Forecasting the Future of the ERCOT Grid, Part 1:
The Ongoing Winter Reliability Challenge
Written By: Michael Reed and Brent Bennett, Ph.D.
Download the full research paper here.
Key Points
- While the operational performance of the ERCOT grid has improved since Winter Storm Uri in 2021, the increasing reliance of the grid on wind, solar, and short-duration storage is eroding the grid’s ability to handle long-duration winter storms.
- The failure of the ERCOT market to properly value the reliability differences between resources has discouraged the financing of new natural gas generation that is key to winter reliability.
- Forecasts show that the trend of relying primarily on intermittent generation to meet demand growth will continue for at least the next few years, which will increase the existing reliability deficit.
- Modeling results show that a 1-in-10-year winter storm in 2030 could result in over 72 hours of outages at a cost to ratepayers of $11 billion.
- While summer outages are possible in 2030 under extreme conditions, those outages will be less destructive than winter outages.
Executive Summary
Texas has made notable improvements to its electric grid since Winter Storm Uri in 2021, particularly through weatherization requirements that have strengthened the performance of gas and coal plants during severe weather. Yet the impact of these gains is being offset by rapid growth in electricity demand and by a generation mix that is becoming more reliant on intermittent wind and solar resources. The result is a widening deficit as new reliable capacity fails to keep pace with rising load. As shown by both Winter Storm Fern in 2026 and the September 2023 heat wave, the grid’s reliance on wind and solar creates gaps that are difficult to predict and cover with a reliable backup supply, particularly in the winter when long-duration storms can quickly sap energy storage.
The 2030 model used in this work shows that the Texas grid is likely to face increasing reliability challenges during winter storms if current trends persist. Under a 1-in-10-year winter storm scenario—characterized by high nighttime demand, low wind, and typical thermal outages—the grid could experience more than 72 hours of outages and over 700 GWh of unserved demand, far exceeding the Public Utility Commission of Texas’s reliability standard (16 TAC §25.508). The economic consequences of such a storm would be significant: $14 billion in extra energy costs plus tens of billions in lost economic output due to the outages. Even in the summer, where solar production helps meet peak daytime demand, a heat wave combining high demand and low wind could result in outages during the late afternoons and evenings across several days.
The causes of this reliability deficit are the structural imbalances in ERCOT’s market design : continuing to optimize for summer peaks while winter risks grow, increasing revenue volatility that makes it difficult to finance new reliable generation, and valuing all generation with the same market clearing price that doesn’t account for differences in reliability. Texas policymakers did not address these issues adequately prior to Winter Storm Uri and have continued to avoid substantial market reform since that time, thus creating underinvestment in reliable generation while wind, solar, and energy storage have attracted over $160 billion in capital (ACPA, n.d.). The longer Texas waits to implement reforms that appropriately value reliability and incentivize new dispatchable thermal generation, the more Texas ratepayers will face escalating outage risks and substantial financial exposure.
INTRODUCTION: RECENT WINTER AND SUMMER WEATHER EVENTS IN TEXAS
The impact of Winter Storm Uri and the devastating electric grid outages that befell Texas on those fateful days in February 2021 still looms large in the minds of the millions of Texans who experienced the event, and Texans rightfully question if the electricity grid will withstand the next major winter storm. This paper will discuss what has changed regarding the Texas grid over the last five years and forecast where it is heading over the next five years, building on previous research our team recently published that outlines the winter reliability challenges Texas still faces.
These questions about the Texas grid arose anew during Winter Storm Fern in January 2026, which occurred just before the five-year anniversary of Uri. Texas was fortunate in that Fern produced mostly sleet instead of freezing rain or wet snow, which meant that power lines and wind and solar generators were largely unaffected. Demand was also not very high because the storm occurred over a weekend, many people stayed home due to icy roads, and some larger industrial users reduced their demand. In fact, peak demand was 5 GW short of the winter record that was set in February 2025 (Woodfin, 2026, p. 5).
What Fern did bring was a prolonged period of low wind and solar output coinciding with the highest demand hours—exactly the type of weather pattern that this research is attempting to model. As shown in Figure 1, wind output averaged around 7 GW from midday on January 25, 2026, to midday on January 26, 2026, about 17% of installed capacity. Solar peaked at only 37% of installed capacity on January 25 and, of course, did not produce any energy during the important overnight hours. Fortunately, since demand was not as high as it could have been and batteries were able to avoid discharging earlier in the storm, there was enough energy storage to cover the peak demand period on the morning of January 26.
The key difference with the model in this work is that we will use higher demand levels consistent with a 1-in-10-year storm instead of a 1-in-2-year storm like Fern. At those higher demand levels, the limited duration of energy storage comes into sharper relief because the batteries are drawn down when the sun sets and cannot be used again until the sun rises the next day, thereby producing prolonged overnight outages.
Another important factor elucidated by Fern is that the weatherization rules passed by the Texas Legislature (SB 3, 2021, p. 17-18) and the Public Utility Commission of Texas (PUC, 2022) are leading to improved winter performance of the gas and coal power plants in Texas. Outages of gas and coal power plants were about 10 GW, in line with the Electric Reliability Council of Texas’s (ERCOT’s) expectations for a typical winter storm (ERCOT, 2025a, p. 16) and less than a third of the amount of failures during Uri (ERCOT, 2021, p. 12). In total, gas, coal, and nuclear supplied over 80% of the energy on the ERCOT grid during the 24 hours comprising height of the storm, with an availability factor of about 87% compared to 16% average availability for wind and solar (see Appendix A for more information about how capacity factors and availability factors are calculated).
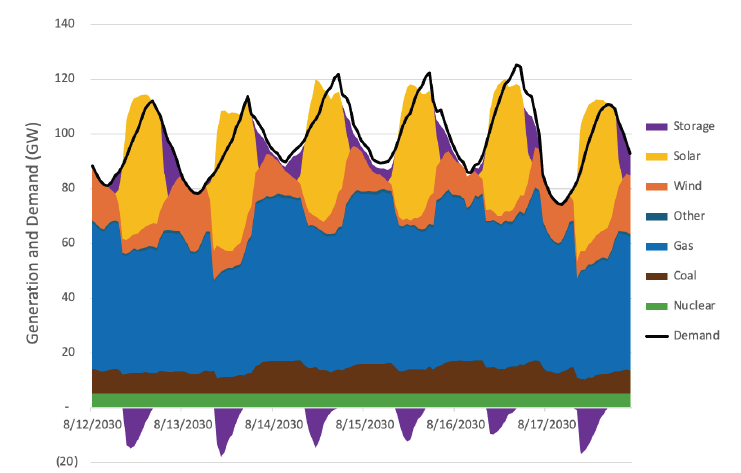
While this paper will focus on assessing extreme winter weather, since winter reliability remains the greatest challenge for the ERCOT grid, it is also important to assess the outlook for future summers. To do so, we will base our summer model on the week of September 3, 2023, which was near the end of one of the hottest summers in recent years and featured a level 2 emergency energy alert (EEA2) on the night of September 6. Figure 2 shows the demand and generation profile for the grid during that week.
A set of unusual, but far from unprecedented, circumstances on September 6 led to the EEA2. First, the entire week saw statewide high temperatures well in excess of 100 degrees and often over 105 degrees, which meant that electricity demand was comparable to demand during the hottest mid-summer days that year (ERCOT, 2023, p. 7). But by September, the sun begins to set significantly earlier than in mid-July, which created about a two-hour window in the evenings when demand was still high, but the sun was down. Adding to the shortage, more gas and coal power plants were offline for maintenance after a long summer with little time for breaks (Gridstatus.io, n.d., see ERCOT Thermal Generation Outages and Outlook).
But what really put the grid under stress on September 6 was that wind generation, which had been above 15 GW for most of the week, dropped to about 5-6 GW during the afternoon and key evening hours, or about 15% of installed capacity. This common tendency for wind to drop to low levels during extreme summer and winter weather events is a defining vulnerability of the ERCOT grid. What makes this phenomenon less concerning in the summer versus the winter is that summer demand falls overnight and into the morning, leaving a short evening window that can more easily be covered by energy storage. In the winter, demand stays more elevated overnight and peaks in the early morning. As solar and energy storage capacity continue to grow in ERCOT, the grid is keeping up with these summer peaks, but those resources are not nearly as useful during the winter peaks.
Figure 1
ERCOT Demand and Generation by Fuel During Winter Storm Fern, January 24-28, 2026
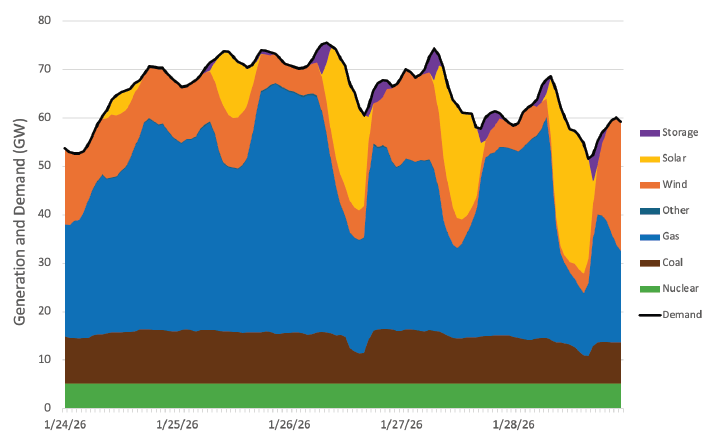
Note: Data from Live monitoring — Electric Reliability Council of Texas, Gridstatus.io, n.d. (https://www.gridstatus.io/live/ercot).
Figure 2
ERCOT Demand and Generation by Fuel, September 3-9, 2023
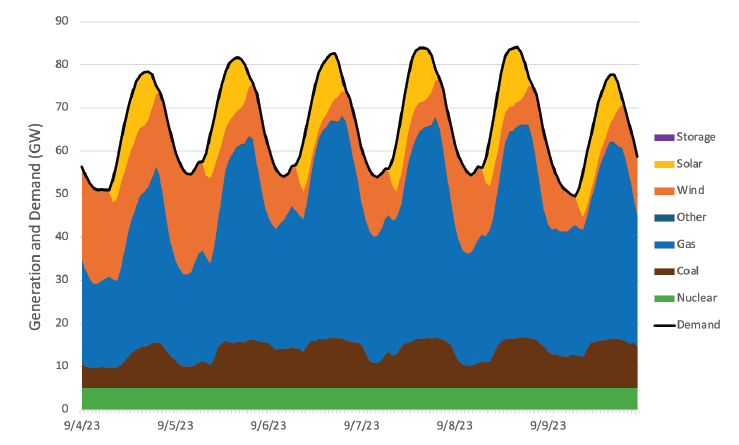
Note: Data from Live monitoring — Electric Reliability Council of Texas, Gridstatus.io, n.d. (https://www.gridstatus.io/live/ercot).
GENERATION AND DEMAND TRENDS IN ERCOT FROM 2021 TO 2030
While Winter Storm Fern showed the operational performance of the ERCOT grid during winter storms has improved since 2021, it also showed this improvement is offset by the lack of new construction of reliable power plants during this time. Since 2021, the gap between reliable capacity (this paper will also use the labels “firm capacity” or “firm output”) and expected peak demand in the winter has grown substantially. As shown in Figure 3, 31 GW of solar, 17 GW of energy storage, and 11 GW of wind have been added to the ERCOT grid since 2021, while only 3 GW of new gas generation has been added over that same period. As a result, the winter reserve margin has shrunk from 17.5% in 2021 to 10% in 2026.
ERCOT is forecasting this trend to continue until at least 2030, with an additional 29 GW of solar, 20 GW of energy storage, and 5 GW of wind expected to come online in the next three to four years (ERCOT, 2025b). In fact, more than 80% of the projects currently in the last stages of development are solar and storage (ERCOT, n.d.-a). Figure 3 adds 5 GW of capacity each to ERCOT’s 2030 projections for wind, solar, and storage to account for likely additions that are not currently all the way through the planning stages. It also includes 10 GW of gas above the 2026 value, assuming the entirety of the currently available Texas Energy Fund is utilized, even though ERCOT projects only 7 GW of new gas installed between 2026 and 2030.
Figure 3
2021, 2026, and 2030 Winter Installed Capacity and Expected Firm Output by Fuel Source in GW
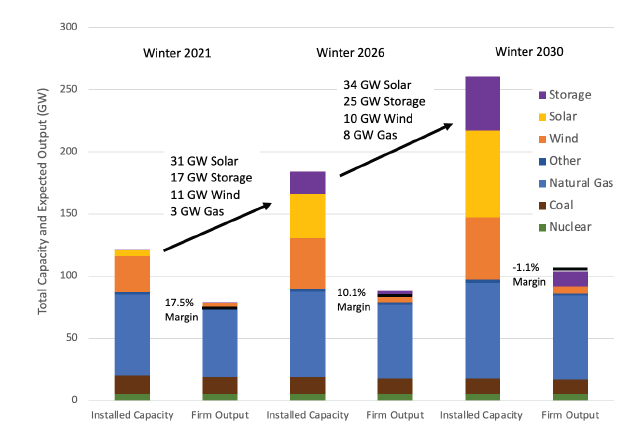
Note: Data from Winter 2021 Seasonal Assessment of Resource Adequacy, Electric Reliability Council of Texas (https://www.ercot.com/files/docs/2020/11/05/SARA-FinalWinter2020-2021.pdf), January 2026 Monthly Assessment of Resource Adequacy, Electric Reliability Council of Texas, p. 4 (https://www.ercot.com/files/docs/2025/11/07/MORA_January2026.pdf), and Report on the Capacity, Demand, and Reserves (CDR) in the ERCOT Region, 2026-2030, Winter Seasonal Summary, Electric Reliability Council of Texas, December 19, 2025 (https://www.ercot.com/files/docs/2025/12/19/CapacityDemandandReservesReport_December2025.pdf).
These numbers are laid out in greater detail in Table 1, which also shows the winter reserve margin could be negative by 2030. In other words, Texas could experience shortfalls in 2030 even under average winter conditions if not enough wind is available during cold winter nights after the sun sets.
The situation is even more challenging than it appears in Table 1 because without energy storage, the 2030 reserve margin would be -14.2%, or a gap of about 15 GW. As shown in some of our prior research (Bennett, 2026), this gap can persist for multiple days during a long-duration winter storm because the batteries have limited ability to recharge during the brief daytime periods when demand is lower and some solar is available. Therefore, by 2030, even a more minor winter storm, with temperatures 10 degrees warmer than what was experienced during Winter Storm Uri, could produce Uri-like outages if the cold persisted for two or three days.
The summer 2030 resource situation is very similar to the winter; if peak daytime demand reaches 115-120 GW, then the demand during the tightest hours (roughly 7 to 9 PM as the sun sets) would be 105-110 GW, which is comparable to the winter peak demand shown in Table 1. The reason that summer is of less concern than winter going forward is because the duration of those scarce periods is limited to that 2-to-3-hour window, instead of the entire evening like in the winter. Therefore, energy storage can discharge the evening hours without exhausting its capacity while also having sufficient time to recharge during the morning hours. With that said, there is still a chance a summer heat wave in 2030 will result in minor outages, as will be discussed later in this paper.
Table 1
2021, 2026, and 2030 Winter Installed Capacity and Expected Firm Output by Fuel Source in MW
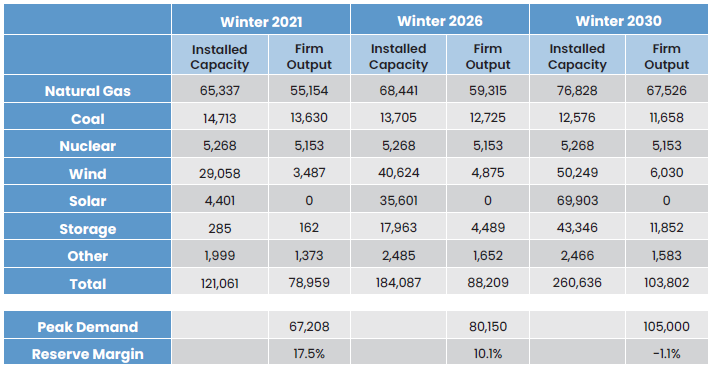
Note: Data is from the same sources used in Figure 3. Peak demand for 2021 is ERCOT’s forecast prior to Winter Storm Uri, taken from Winter 2021 Seasonal Assessment of Resource Adequacy, Electric Reliability Council of Texas, November 5, 2020, p. 2 (https://www.ercot.com/files/docs/2020/11/05/SARA-FinalWinter2020-2021.pdf). Peak demand for 2026 is the actual hourly peak demand observed on February 20, 2025, taken from Live monitoring — Electric Reliability Council of Texas, Gridstatus.io, n.d. (https://www.gridstatus.io/live/ercot). This number is higher than the peak demand observed during the winter storm in January 2026 but is consistent with historical trends. Peak demand for 2030 is the authors’ estimate (see the Model Assumptions section for more information).
The key takeaway from these forecasts is that the heavy skew of the new generation in ERCOT toward solar and storage since 2021—and the likely continuation of that trend until 2030—is creating a significant winter reliability deficit. Thermal resources may grow as federal subsidies for wind and solar are terminated by 2030, but the forecasted growth of thermal generation is far less than expected consumption growth, even under relatively conservative scenarios of data center demand. The remainder of this paper will discuss these reliability risks in greater detail and model the economic costs of the ERCOT market’s failure to procure sufficient reliable capacity.
MODEL ASSUMPTIONS: HIGH GROWTH OF DEMAND, SOLAR, AND STORAGE AND LOW GROWTH OF GAS
The year 2030 models in this paper were created using the UPlan Network Power Model (UPlan-NPM) from LCG Consulting (LCG, n.d.), which provides software and consulting services for several grid operators in the U.S., including ERCOT. UPlan-NPM is a combination of physical and economic models that mimics the physical geography of the ERCOT market—location, size, and type of generators, and how they are connected to load through transmission lines—and coordinates the dispatch of each generator to meet demand. Concurrently, it determines energy prices at each node based on the highest cost generator that dispatches at that location and transmission constraints.
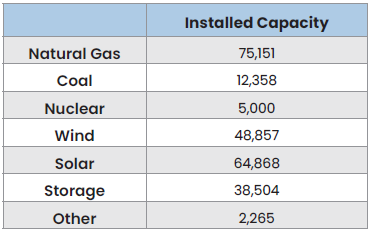
The starting point of the 2030 model was provided by LCG and modified based on data from ERCOT’s December 2025 capacity, demand and reserves (CDR) report (ERCOT, 2025b). The installed capacities for each generation resource used in the model are shown in Table 2. Note that there are a few differences between the capacities in this table and the 2030 capacities in Table 1, which are due to differences in how the model rates certain resources and due to constraints in placing generators geographically in the model environment.
Table 2
2030 Model Generation and Storage Capacity by Fuel Source in MW
The transmission system in the model includes the proposed 765-kV lines shown in ERCOT’s 2024 Regional Transmission Plan (RTP) and the associated upgrades of lower voltage transmission lines (ERCOT, 2025c). It is optimistic to assume the 765-kV lines in the RTP will be entirely completed and operational by the summer of 2030, but it could also be argued the generation and demand assumptions used here are aggressive and more likely represent a 2031 or 2032 model year instead of 2030. Regardless, the goal of this work is to assess resource adequacy and the impact of the resource mix on the economics of the ERCOT market. Having excess transmission capacity across the ERCOT grid helps minimize the confounding effects of transmission congestion on the model output.
In light of the aggressive projections for data center demand growth in ERCOT, load forecasting is particularly challenging right now (see Bennett, 2026, pp. 4-5). Our goal was to set the base case demand low enough to ensure the modeled system has some spare capacity and no unserved load while avoiding setting it so low that the system would be oversupplied even during an extreme weather event. Striking this balance meant using considerably lower demand in the base case than what is in ERCOT’s CDR report. For the baseline, we set the peak summer load to 115 GW, compared to ERCOT’s 2030 projection of 132 GW, and 98 GW in the winter, compared to ERCOT’s projection of 120 GW (ERCOT, 2025b).
After establishing a base case, the next steps are to model a 1-in-10-year a winter storm and a summer heat wave (hereafter labeled winter and summer stress scenarios) by scaling up the base case demand curve for a three-day period in the winter and a four-day period in the summer. The winter load curve was formed by manually inputting values to create a similar pattern to what was seen in both Winter Storms Uri and Fern, with the peak demand on the first evening reaching ~110 GW (see Figure 4). The summer load curve was derived by simply applying a multiplier to the model’s load shape that changed the peak value to ~125 GW (see Figure 5).
Matching Generation and Consumption in Electric Grids
Planning for electricity consumption growth not only involves understanding the larger systematic issues associated with annual load growth; seasonal, daily, and hourly consumption patterns also need to be considered. Because the electric grid must be perfectly synchronized at all times, the production and consumption of electricity are different from most commodities that have more flexibility in their supply chains. These unique characteristics are demonstrated by contrasting electricity production and consumption with the production and consumption of liquid transportation fuels.
In general, producing transportation fuels starts with the extraction of crude oil and transporting the crude oil to a refinery. At the refinery, the crude is processed into familiar liquid fuels such as gasoline, diesel fuel, and aviation fuel. The fuels are distributed by pipeline, barge, and truck to end use facilities (e.g., gas and diesel stations, aviation depots, etc.) where the fuel is stored until needed. There are also storage facilities along the distribution pathway. This massive amount of infrastructure is all designed to ensure the fuels are delivered when and where consumers need them.
The creation and delivery of electricity follow a parallel path. Gas, coal, and nuclear fuels are extracted, processed, and sent to power production plants, where they are converted into electricity. Wind and solar energy are extracted and converted into electricity all in one process. The electricity grid has a distribution system that delivers the electricity to end users including homes, businesses, and industrial facilities through a mix of high voltage transmission lines, substations, distribution lines, transformers and other equipment. The end result, as with liquid fuels, is real-time delivery of energy to consumers as they demand it.
A key difference between the liquid fuel supply chain and electricity production is the lack of sufficient electricity storage to cover both regular and irregular changes in demand. The grid has historically relied on the ability of gas and coal generators to adjust their output to match demand, which must be done every second of every day, unlike liquid fuel delivery systems that have more flexibility to absorb supply disruptions. While the capacity of battery systems is growing, the amount of energy they store is currently thousands of times smaller than just the amount of energy in stored natural gas in the U.S., much less the amount of energy stored in other liquid fuels (EIA, n.d.; SEIA, 2026). Therefore, the ability of batteries to assist in high capacity, long-duration winter storms is still limited.
The problem the grid now faces is that intermittent wind and solar are relied upon more and more for capacity during extreme weather events, instead of just as marginal resources. The effective “energy storage” capacity provided by gas and coal power plants that ramp their output to match demand is slowly being eroded. Batteries that can manage intermittency are getting cheaper, but it is still nearly 5-10 times more expensive to store electricity in a battery than it is to burn stored energy from natural gas (EIA, 2026; Cole et al., 2025, p. v). While batteries can complement gas, coal, and nuclear generation and help with grid operations, relying on them to fully replace that dispatchable generation is a risky proposition that would require massive expenditures to manage effectively.
IMPACT OF A SIGNIFICANT WINTER STORM IN 2030
A key challenge with winter storms in Texas, which was exhibited in Winter Storms Fern and Uri, is that wind and solar production tend to decline at the same time demand is at its highest. To model that outcome here, we reduced wind generation by 40% compared to the base case model, roughly matching the low 10% wind profile in ERCOT’s most recent resource adequacy models (ERCOT, 2025d, p. 22). Solar generation was reduced by 50% compared to the base case, and thermal power plant outages were set at about 10 GW, which is comparable to what was experienced during Winter Storm Fern (Woodfin, 2026, p. 12) and comparable to ERCOT’s latest assessments (ERCOT, 2025a, p. 16).
Figure 6 shows the generation and load profile for the modeled storm. Almost as soon as demand begins rising above the baseline, supply is not able to keep up due to low wind conditions. Even when there is just enough supply, transmission constraints appear to be creating small gaps that keep the system from avoiding outages. Without any excess power to recharge the large quantity of batteries on the system, those batteries are unable to fill in the gaps. While Winter Storm Fern showed batteries are willing to wait until the peak of the storm to discharge (unlike the model here that shows them discharging very early on), they will still have only one opportunity to discharge across the three days of the storm.
Figure 4
ERCOT Load for 2030 Base Case and Winter Stress Scenario
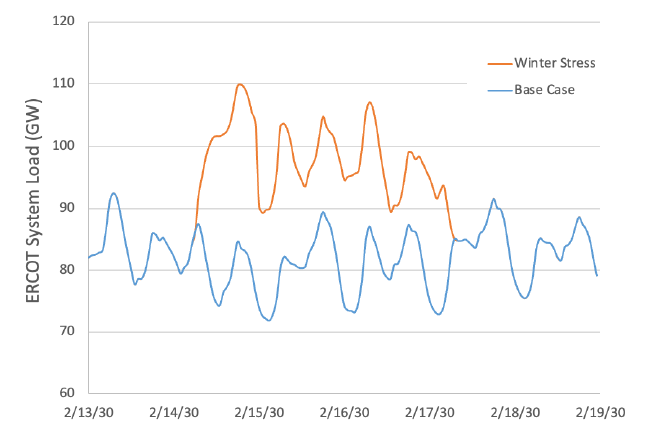
Figure 5
ERCOT Load for 2030 Base Case and Summer Stress Scenario
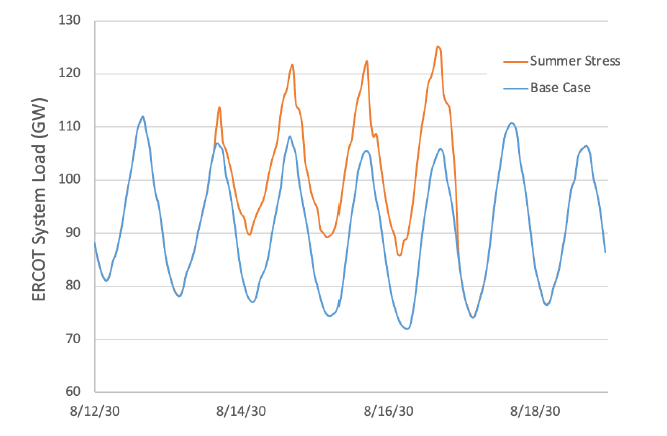
Figure 6
Winter Stress Scenario Generation by Fuel and System Demand
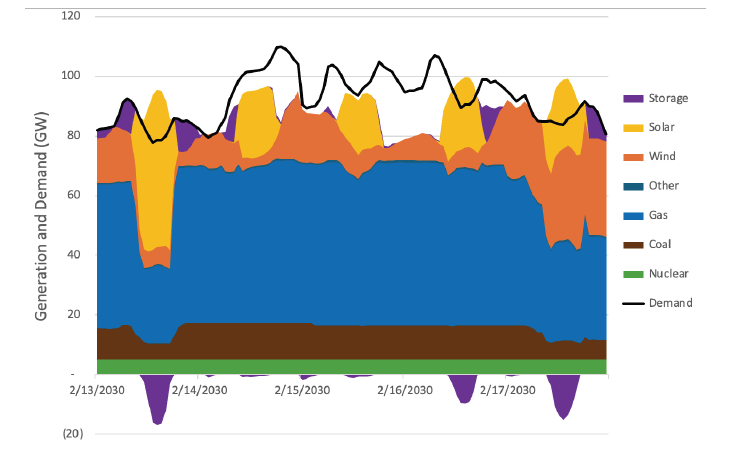
The end result of these converging problems is nearly 72 hours of outages with 28 GW out at the peak, comparable to the size of the outages during Uri. The total unserved load during the period is 713 GWh, or about 10% of the total demand during that time. Both the duration and magnitude of the outages far exceed the limits established by the PUC’s reliability standard (16 TAC §25.508). This scenario also leads to $13.6 billion in excess energy costs, adding 42% to the $32.6 billion in total annual energy costs in the base case (see Table 3).
Not surprisingly, as shown in Figure 7, the largest outages during this storm and the periods of highest prices align with the periods of lowest wind and solar output. This is to be expected when there is sustained high demand that exceeds the combined capacity of the thermal units in the system (in this case by more than a third), and energy storage is not available to fill in the gaps. At this point, the system is fully exposed to the intermittency of wind and solar because it does not have enough dispatchable resources to balance them. This model also shows winter outages will become more frequent unless the future resource mix includes a higher percentage of dispatchable resources. While we project a 1-in-10-year storm here, it is clear from Figure 6 even a 1-in-2-year storm with 10 GW less demand could easily result in outages if wind generation is low.
The final important conclusion to draw from this modeling is that the winter outage risk is entirely driven by the ERCOT region’s reliance on wind, solar, and storage to meet rising demand. The peak demand during the winter storm modeled here, at 110 GW, is still less than the 120 GW peak summer demand in the base case. If the ERCOT region was building sufficient gas generation to cover base summer demand with a 10% reserve margin, providing over 130 GW of reliable supply, then the grid would easily avoid outages during this 1-in-10-year storm. Even if thermal outages were at 15 GW, the grid would still have more than 5 GW of excess capacity during the entire storm.
Figure 7
Winter Stress Scenario Combined Wind and Solar Capacity Factor and Real-Time Energy Prices
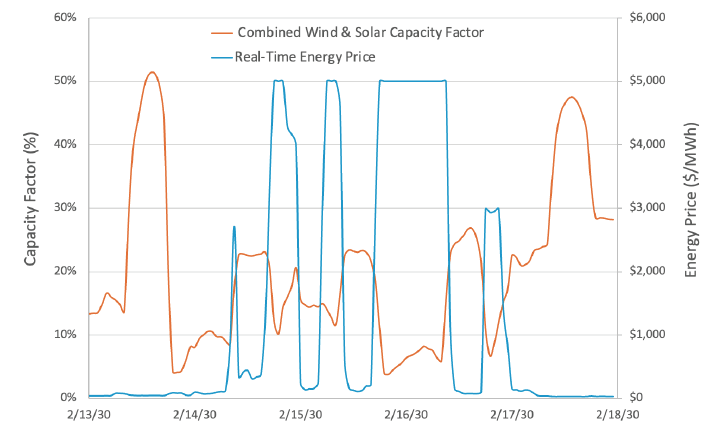
Note: The combined wind and solar capacity factors are calculated by dividing the sum of wind and solar generation each hour by their combined installed capacity (see Appendix A for more explanation). Real-time energy prices are the ERCOT bus averages outputted by the UPlan model.
IMPACT OF A SUMMER HEAT WAVE IN 2030
There are several differences between summer and winter extreme weather in Texas that make the summer reliability risk considerably lower than the winter risk. While peak summer demand is higher (15 GW higher than winter peak demand in these stress scenarios), that peak occurs during the middle of the day when plenty of solar capacity is available. But, in the evening, as solar generation dissipates while demand is still elevated, the system ends up being several GW short. Unlike in winter storms, where consistent elevated demand leads to prolonged outages, demand drops off at night and into the morning, allowing batteries to recharge and the grid to recover before high demand returns in the afternoon. However, on the peak days, there is not enough energy storage available to cover off the entire evening, which leads to minor outages and emergency conditions throughout the night.
The model shown in Figure 8 resulted in 231 GWh of unserved load spread out over four to five days. The good news is, while outages occur repeatedly during this heatwave, each occurrence is only a few hours, and the total shortage is only about 3% of total demand during those hours. The bad news is the economic cost is still substantial. Figure 9 shows even though excess solar generation keeps prices lower for most of the daytime hours, the consistent scarcity pricing during the evenings adds up to a $1.3 billion total hit to the energy market.
One interesting aspect of the summer heat wave is that systemwide prices never exceed $1,000/MWh, even though one would expect prices to reach the $5,000/MWh cap during emergency conditions.
Figure 8
Summer Stress Scenario Generation by Fuel and System Demand
This is happening because some regions of ERCOT are sufficiently supplied during these hours even as some regions experience shortages. There is not enough transmission capacity to move the power from one region to the other because the lines are already so full during these peak hours. Therefore, shortages are occurring in the middle of the day even though there is technically enough capacity across the whole system to meet peak demand during those hours. The result is a series of localized outages and very disparate pricing across the state.
Figure 9
Summer Stress Scenario Combined Wind and Solar Capacity Factor and Real-Time Energy Prices
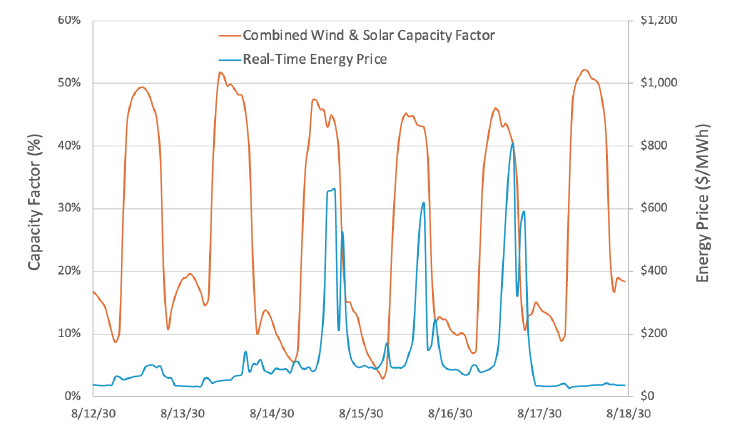
Note: The combined wind and solar capacity factors are calculated by dividing the sum of wind and solar generation each hour by their combined installed capacity (see Appendix A for more explanation). Real-time energy prices are the ERCOT bus averages outputted by the UPlan model.
This is a somewhat surprising result given, as we noted earlier, that the proposed 765-kV STEP projects (ERCOT, 2025c) are included in this model. While those lines are likely alleviating some congestion issues, they are not eliminating those issues entirely. What would eliminate the congestion are more local transmission upgrades and more gas generation properly sited close to demand centers, instead of relying on variable wind and solar located far from demand as the modeled system does. While optimizing the location of generation and transmission is outside the scope of this study, this work shows that adding more wind and solar to the already lopsided generation mix and topology of the ERCOT grid creates problems beyond just the resource adequacy issues addressed in this paper.
CONCLUSION: WHAT TEXAS NEEDS TO DO NOW TO IMPROVE GRID RELIABILITY
Since Winter Storm Uri, Texas policymakers have taken steps to improve the reliability and resiliency of the electricity generation and delivery systems, the results of which are evident in the improved performance of the ERCOT grid during recent winter storms. However, several concerning trends are converging to create continued reliability challenges over the next several years:
- Rapid demand growth driven by a combination of data centers, new industrial facilities, and consistent population growth. Demand has grown by almost 20% over the past five years1 and is set to grow another 30-40% over the next four years (ERCOT, 2025b).
- Continued overinvestment in wind, solar, and batteries. Over $60 billion (ACPA, n.d.)2 has been invested in 31 GW of solar, 17 GW of batteries, and 11 GW of wind since Winter Storm Uri (ERCOT, n.d.-c), and 80% of the generation that is in the later planning stages in ERCOT is solar and storage (ERCOT, n.d.-a).
- Continued underinvestment in new natural gas generation and secure gas supplies that are needed to manage future winter storms. Only 3 GW of new natural gas generation has been completed since Winter Storm Uri (ERCOT, n.d.-c), and ERCOT projects only 7 GW more will be added over the next few years (ERCOT, n.d.-a).
The combined effect of these trends is to make prolonged outages during long-duration winter storms more likely, and each such storm can cost ratepayers well over $10 billion. Extreme demand in the summer can also lead to shorter-duration outages after the sun sets, and repeated occurrences during a hot summer like what Texas experienced in 2023 can also lead to billions of dollars in excess energy costs.
These conclusions point to the need for two policy changes to correct for the bias in the ERCOT market toward intermittent resources and the tendency for the market to optimize for summer instead of winter:
- Value the reliability differences between generators appropriately by requiring all generators to meet a reliability standard and reducing revenue for generators that fail to meet the standard. The Texas Legislature created such a program for generators that begin operating in 2027 or later (HB 1500, 2023, Sec. 23) but so far has not passed legislation to apply this requirement to existing generators (SB 715, 2025).
- Reduce revenue volatility by ensuring reliable generators receive more consistent payments for being available during winter storms, instead of relying on scarcity pricing that may only come once every few years.
In addition to these market reforms, policymakers should encourage the incorporation of flexible demand that can curtail during emergency conditions. One known pathway to do this is Planning Guide Revision Request 134 (PGRR 134; Sharma Frank, 2025), which is under consideration at ERCOT right now. PGRR 134 would allow new large loads like data centers to register only a portion of their demand as firm, so ERCOT and the transmission utilities would only need to allocate enough transmission and distribution infrastructure to meet their firm demand instead of their total demand. This change would allow these loads to connect to the grid faster in places where transmission is limited and put more computing demand at each location on the grid without creating more reliability problems.
If the 20 GW of on-grid data center load that we project in this model could reduce its demand during peak hours by 50%, it would be the equivalent of immediately adding an additional 10 GW of new gas generation. Getting that generation built and interconnected—on top of the 10 GW already in our forecast—is unlikely over the next few years, even if market reforms are implemented right now. Flexible demand is a solution that can be implemented now and provide both a short-term bridge until broader market reforms are implemented and a long-term hedge against system volatility. Future work in this series will assess the ability of both market reforms and flexible demand to solve the ongoing reliability challenges Texas faces.
REFERENCES
American Clean Power Association (ACPA). (n.d.). Texas state fact sheet in Clean power state-by-state (webpage). Retrieved January 20, 2026, from https://cleanpower.org/facts/state-fact-sheets/
Bennett, B. (2026). Fool me twice: Why the Texas grid is still vulnerable to winter storms, Part 2. Texas Public Policy Foundation. https://www.texaspolicy.com/wp-content/uploads/2026/01/2026-01-Texas-Grid-Still-Vulnerable-Part-2.pdf
Cole, W., Ramasamy, V., & Turan, M. (2025). Cost projections for utility-scale battery storage: 2025 update. National Renewable Energy Laboratory. https://docs.nrel.gov/docs/fy25osti/93281.pdf
Energy Information Administration (EIA). (2026, January 22). Natural gas weekly update. https://www.eia.gov/naturalgas/weekly/
Energy Information Administration (EIA). (n.d.). Lower 48 states natural gas working underground storage. Retrieved March 6, 2026, from https://www.eia.gov/dnav/ng/hist/nw2_epg0_swo_r48_bcfw.htm
Electric Reliability Council of Texas (ERCOT). (n.d.-a). GIS_Report_December2025 in GIS report (webpage). Retrieved January 20, 2026, from https://www.ercot.com/mp/data-products/data-product-details?id=pg7-200-er
Electric Reliability Council of Texas (ERCOT). (n.d.-b). Capacity changes by fuel type charts December 2025 in Resource adequacy (webpage). Retrieved January 20, 2026, from https://www.ercot.com/gridinfo/resource
Electric Reliability Council of Texas (ERCOT). (2021, April 27). Update to April 6, 2021 preliminary report on causes of generator outages and derates during the February 2021 extreme cold weather event. https://www.ercot.com/files/docs/2021/04/28/ERCOT_Winter_Storm_Generator_Outages_By_Cause_Updated_Report_4.27.21.pdf
Electric Reliability Council of Texas (ERCOT). (2023, November 17). ERCOT monthly operational overview (September 2023) revised 11.17.23. https://www.ercot.com/files/docs/2023/11/17/REVISED-ERCOT-Monthly-Operational-Overview-September-2023.pdf
Electric Reliability Council of Texas (ERCOT). (2025a). 2024 grid reliability and resiliency assessment final update. https://www.ercot.com/files/docs/2025/01/28/2024_Grid_Reliability_and_Resiliency_Assessment_Results_January_2025_RPG.pdf
Electric Reliability Council of Texas (ERCOT). (2025b, December 19). Report on the capacity, demand and reserves (CDR) in the ERCOT Region, 2026-2030. https://www.ercot.com/files/docs/2025/12/19/CapacityDemandandReservesReport_December2025.pdf
Electric Reliability Council of Texas (ERCOT). (2025c). 2024 regional transmission plan (RTP) 345-kV plan and Texas 765-kV strategic transmission expansion plan comparison. https://www.ercot.com/files/docs/2025/01/27/2024-regional-transmission-plan-rtp-345-kv-plan-and-texas-765-kv-strategic-transmission-expans.pdf
Electric Reliability Council of Texas (ERCOT). (2025d, November 7). January 2026 Monthly Outlook for Resource Adequacy (MORA). https://www.ercot.com/files/docs/2025/11/07/MORA_January2026.pdf
GridStatus.io. (n.d.). Live monitoring — Electric Reliability Council of Texas. Retrieved March 3, 2026, from https://www.gridstatus.io/live/ercot
HB 1500. Enrolled. 88th Texas Legislature. Regular. (2023). https://capitol.texas.gov/tlodocs/88R/billtext/pdf/HB01500F.pdf
LCG Consulting. (n.d.). UPlan network power model. Retrieved March 3, 2026, from http://www.energyonline.com/Products/Uplane.aspx
Public Utility Commission of Texas (PUC). (2022). Order repealing 16 TAC 25.55 and adopting new 16 TAC 25.55, as approved at the September 29, 2022 open meeting in Project No. 53401. https://interchange.puc.texas.gov/search/documents/?controlNumber=53401&itemNumber=39
Public Utility Commission of Texas (PUC). (n.d.). 16 TAC §25.508. Retrieved March 6, 2026, from https://ftp.puc.texas.gov/public/puct-info/agency/rulesnlaws/subrules/electric/25.508/25.508.pdf
Solar Energy Industries Association (SEIA). (2026, February 23). New report: U.S. adds 58 GWh of new energy storage capacity in 2025, largest single year of new battery capacity on record. https://seia.org/news/united-states-installs-58-gwh-of-new-energy-storage-in-2025/
Sharma Frank, A. (2025). 134PGRR-01 Interconnection Studies Reform for Dispatchable Loads 110125 in PGRR 134: Key Documents (webpage). Electric Reliability Council of Texas. https://www.ercot.com/mktrules/issues/PGRR134#keydocs
SB 3. Enrolled. 87th Texas Legislature. Regular. (2021). https://capitol.texas.gov/tlodocs/87R/billtext/pdf/SB00003F.pdf
SB 715. Engrossed. 89th Texas Legislature. Regular. (2025). https://capitol.texas.gov/tlodocs/89R/billtext/pdf/SB00715E.pdf
Woodfin, D. (2026). Item 9.3: System operations update. Electric Reliability Council of Texas. https://www.ercot.com/files/docs/2026/02/04/9.3-System-Operations-Update-REVISED.pdf
APPENDIX A: CALCULATING CAPACITY FACTORS AND AVAILABILITY FACTORS
How to Calculate Capacity Factors
The capacity factor of electricity generation is found by dividing the amount of electricity that was generated in a specific time frame by the maximum amount of power that could be generated during the same period. For example, a specific gas turbine generates 50 MWh during a 1-hour period, but the maximum the turbine could have generated is 100 MWh. This results in a capacity factor of 50%. This metric can be applied to a fleet of generators over any period.
Using 2025 data from ERCOT, the annual capacity factor of various generation sources is shown in Table A.1. What this data simply means is that for a wind facility with a name plate value of 100 MW, the average hourly output is 32 MWh of electricity. For a solar facility with a name plate value of 100 MW, the average hourly output is 22 MWh of electricity. It doesn’t say anything about the variance of that generator’s output around the mean or the ability to control (dispatch) that generator’s output.
The capacity factors for nuclear, coal, and natural gas combined cycle are higher than those of wind and solar because their output (most of the time) does not depend on fuel availability and because they are dispatched before less efficient simple cycle gas units. The remaining natural gas assets are peaking units designed to operate as fast on/off and ramping assets to assist demand and supply balancing during marginal hours. Hence, their capacity factor is much lower. It is important to note that if wind/solar did not crowd out production from thermal units (natural gas in particular), the capacity factors of those units would be significantly higher.
Table A.1
2025 ERCOT Annual Capacity Factors by Fuel Source
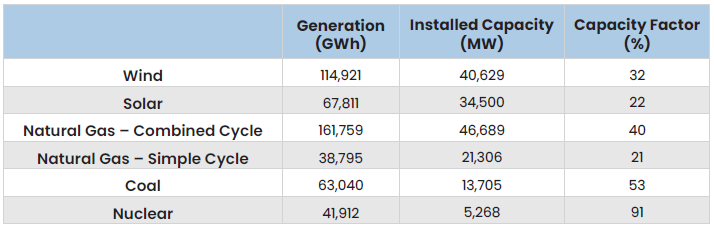
Note: Generation data from Generation: Fuel Mix, “Fuel Mix Report: 2025”, Electric Reliability Council of Texas, February 9, 2026 (https://www.ercot.com/gridinfo/generation). Installed capacity data from Monthly Outlook for Resource Adequacy (MORA) December 2025, Electric Reliability Council of Texas, October 3, 2026 (https://www.ercot.com/gridinfo/resource).
How to Calculate Availability Factors
In addition to capacity factors, availability factors are an important metric for comparing different generation resources. The availability factor compares how much a resource is able to produce over a specified time frame to its installed capacity, taking into account the fact that resources are often available to generate but do not do so for economic or technical reasons.
For thermal units, the availability factor is calculated by dividing the amount of generation that is on outage (both planned and unplanned) by the total installed capacity. Wind and solar must be treated differently because a lack of fuel availability (wind isn’t blowing or the sun isn’t shining) is not recorded as an outage or a derate like it is for thermal units. Also, since they have almost zero marginal cost and are always dispatched first into the grid, they are almost always producing at their maximum availability. While they are sometimes curtailed due to transmission congestion or negative pricing, these occurrences are rare during the hours of system stress when availability factors are most relevant. For these reasons, availability factors for wind and solar are derived by dividing the actual generation of each resource by the installed capacity.
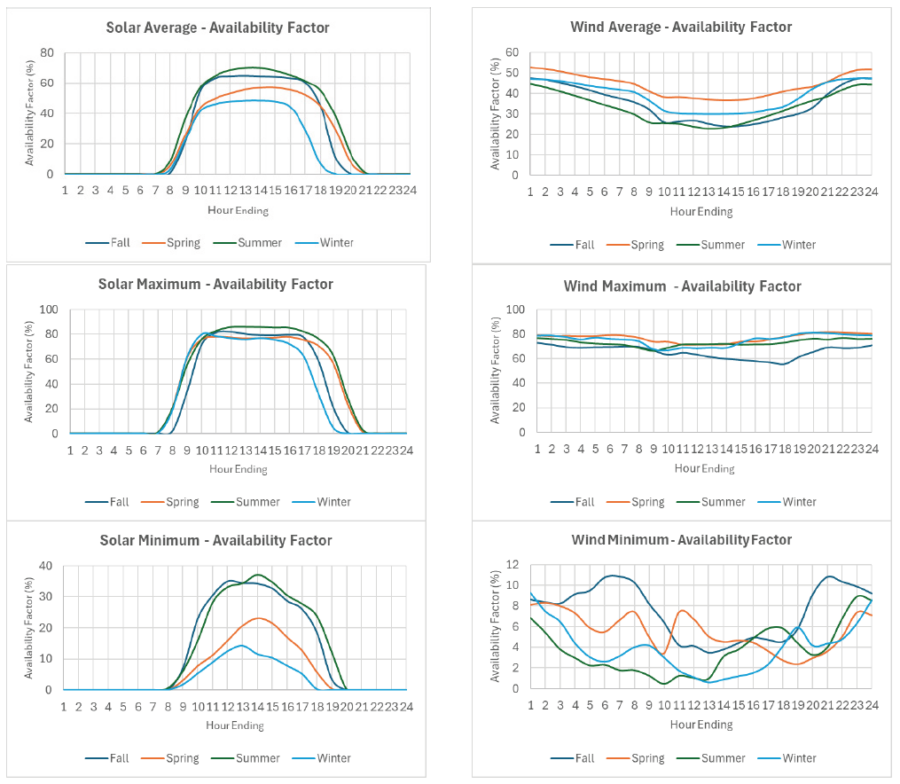
Using 2025 ERCOT data, the following graphs in Figure A.1 (next page) show average, minimum, and maximum hourly availability factors of solar and wind for the four ERCOT seasons. Summer solar generation varies from almost 90% availability on the sunniest days down to 35% on the cloudiest days, averaging around 70%. Winter availability can be as high as 75% and as low as 10-15%. A good feature of solar in the summer is that demand is usually lowest on cloudy days, whereas the opposite is true in the winter, where sunny days bring the lowest demand. Also, winter storms often bring clouds and high demand in unison, in addition to the fact that winter demand peaks in the morning and at night when the sun is down. Therefore, solar often helps the grid in the summer, reducing variance and system stress during peak afternoon hours, while working against the needs of the grid during the winter.
Wind generation shows a more variable range of production, and it usually trends opposite to solar, with the highest capacity factors occurring overnight. Average production varies from a high of ~55% at night to a low of ~22% during the middle of the day, depending upon the season. What is most challenging for grid operations is predicting minimums in wind production. As shown in the bottom right pane of Figure A.1, wind availability can drop below 10% during almost any hour of the year and is sometimes as low as 1%, meaning that the 40 GW of installed wind capacity in ERCOT is producing only 400 MW. These minimums frequently occur during the hottest and coldest periods of the year, which are accompanied by high-pressure systems and stable air that suppresses wind production statewide.
Figure A.1
2025 ERCOT Hourly Average, Minimum, and Maximum Availability Factor of Wind and Solar Generation
Note: Generation data from Generation: Fuel Mix, “Fuel Mix Report: 2025”, Electric Reliability Council of Texas, February 9, 2026 (https://www.ercot.com/gridinfo/generation). Installed capacity data from Monthly Outlook for Resource Adequacy (MORA) December 2025, Electric Reliability Council of Texas, October 3, 2026, (https://www.ercot.com/gridinfo/resource).