Texas’s housing market is challenged by supply-side constraints, rooted in restrictive zoning, large-lot mandates, escalating regulatory fees, and runaway property taxation.
Key Points:
- Texas’s housing affordability crisis is supply-driven: a 306,000-home shortfall, falling permits, and a $321,000 median price reflect regulatory barriers blocking construction needed to meet population growth.
- Government regulation accounts for 23.8% of a new home’s price ($93,870) and 40.6% of multifamily costs, among the largest single drivers of unaffordability.
- Texas property taxes hit $89.4 billion across nearly 5,000 taxing units in 2025, growing 364% since 1998—far outpacing population and inflation combined.
Click here to download the full paper
Executive Summary
This report examines Texas’s housing market conditions, the structural constraints on development, and the state’s capacity to restore affordability. It argues that the affordability crisis is supply-driven rather than demand- or subsidy-driven, evidenced by an estimated 306,000-home shortfall in 2021, the 90% of Texans reporting housing affordability as a problem, and the 51% of renters, approximately 2.1 million households, classified as cost-burdened. Importantly, it distinguishes affordable housing, a category of price-restricted units, from housing affordability, a market-wide relationship between costs and incomes, and argues that durable gains require expanding the naturally occurring affordable stock. Its organizing framework, the PITI+, treats principal interest, taxes, insurance, and the regulatory premium embedded in each as a monthly-payment problem, directing state attention to the components Texas can reasonably influence.
This report examines Texas’s housing market conditions, the regulatory constraints on development, and to what extent the state may restore the conditions of affordability. Arguing that while demand factors and the influence of subsidies impact housing supply, the primary area of focus for Texas legislators ought to formalize in the shape of deregulation. Importantly, we distinguish affordable housing, a category of price-restricted units, and housing affordability, a market wide relationship between costs and income, finding durable gains require expanding the naturally occurring housing stock. In short, our housing paper asks for “the serenity to accept the things I cannot change the courage to change the things I can and the wisdom to know the difference.”
Introduction
Texas is in the midst of a housing crisis, exacerbated by robust population growth, rising demand, and government overregulation. This crisis is perhaps best evidenced by the lack of adequate housing stock. According to the Texas Comptroller of Public Accounts (n.d.), Texas was an estimated 306,000 homes short of what was needed in 2021. As a result of this shortage and other factors, the cost of housing has spiked to such an extent that 90% of Texans consider housing affordability to be a problem in their part of Texas, according to a 2024 poll conducted by the Hobby School of Public Affairs at the University of Houston (Adams et al., 2024). The affordability crisis is especially pronounced for renters. 30% of household income has been used as a measuring stick to bring ‘affordability’ from the realm of abstract concepts to one that can be measured. According to Harvard University’s Joint Center for Housing Studies (2024), 51% of Texas renters, or 2.1 million households, are classified as cost-burdened, meaning those persons spend more than 30% of their income on housing-related expenses.
The factors contributing to the present dynamic are easily summarized: lending, labor, lumber, lots, and laws, as the National Association of Home Builders (2025) has long phrased the supply-side challenge. Each input has tightened over the past several years. Lending costs rose with the Federal Reserve’s tightening cycle. Construction labor remains scarce. Lot scarcity is endemic in high-demand metros. And the legal-regulatory layer—the laws that govern what may be built, where, and at what density—has accumulated for a century. To this canonical pentameter we propose a small but consequential update. Lumber prices have stabilized in the post-pandemic period. Insurance premiums have not. The proper formulation for today’s Texas housing market is lending, labor, lots, laws, and loss costs, with the last item capturing the property-insurance and catastrophe-risk repricing that has emerged as a binding constraint on Texas homeownership.
The cumulative effect of these forces is that a large share of households are being priced out of the market entirely. The National Association of Home Builders’ (NAHB) 2025 priced-out analysis demonstrates that for every $1,000 increase in the median new home price, approximately 115,593 U.S. households can no longer afford a median-priced new home, and that for every quarter-percentage-point increase in mortgage interest rates, an additional 1.1 million households are similarly displaced (NAHB, 2025b). The implication is straightforward: housing policy decisions that move the needle on price or rate by even modest amounts have outsized effects on the share of Texans able to participate in the market.
To gain a deeper understanding of Texas’s housing market, its present condition, and the path forward, it is critical to develop a shared conceptual framework of this policy sphere, its stakeholders, and its central terms of art. To that end, the following sections explore widely agreed-upon terms and ideas useful in the Texas context, articulate the policy aims that should govern reform, assemble the empirical indicators by which a serious diagnostic of the market should proceed, catalog the structural challenges that constrain Texas supply, and propose measurable success criteria. While cliché, it is a truism that families turn houses into homes; sound policy can help turn houses into something Texas families can afford in the first place.
Housing Policy Aims
Sound housing policy begins with sound aims. The proper aim of state-level housing policy is not to engineer particular outcomes for particular households, but to restore the conditions under which a free market in homes can clear at prices and quantities that Texans can afford.
Affordable Housing vs. Housing Affordability
A persistent confusion plagues the policy debate: the conflation of affordable housing with housing affordability. The former is a thing, a category of housing units whose rents or prices are restricted by a subsidy program, deed restriction, or regulatory covenant. The latter is a condition, the broad relationship between housing costs and household incomes across the entire market. They are not the same.
One widely used definition of affordable housing states, “Affordable Housing Policies refer to government initiatives and regulations designed to ensure that individuals and families can access housing that is economically viable, typically defined as costing no more than 30% of their income” (Fiveable, n.d.). Strong Towns (2016) offers two further refinements that are particularly useful in the Texas context. Naturally occurring affordable housing—sometimes called NOAH—is housing that is available on the regular market, open to anyone and not subsidized by a government or nonprofit, but which happens to be within the budget of many families. Most affordable housing in America falls into this category. In many cities, the naturally occurring affordable housing tends to be older, less well cared for, or located in less desirable neighborhoods compared with newer construction accessible only to higher-income families. Market-rate housing, by contrast, is housing available on the private market, not subsidized or limited to any specific income level (Strong Towns, 2018).
The distinction matters because it determines policy strategy. Affordable housing policy works through providing subsidies to qualifying households, distributing scarce public funding across a target population. Housing affordability policy works through an emphasis on supply-side economics and targeting the cost of housing specifically, with the aim of expanding the range of homes available for consumption without public assistance. Durable affordability gains require expansion of the naturally occurring stock, which in turn requires regulatory and fiscal conditions that allow the market to deliver homes across a wider band of price points (Sands, 2025).
Choosing the Right Metric: From Cost Burden to PITI+
“30% of income” is a useful but insufficient measure, which raises the question, “What is the right one?” We propose a framework called PITI+: principal, interest, taxes, insurance, plus the embedded regulatory premium that compounds inside each.
The standard PITI calculation is a familiar feature of mortgage underwriting. What justifies the “+” is the magnitude of the regulatory tax embedded in each component. Principal reflects the cost of land, labor, and materials, all of which carry zoning premiums, parking minimums, and design mandates. Interest is set by the bond market and the Federal Reserve, but the eligible loan pool is narrowed by federal underwriting rules. Property taxes—the second-largest component of the typical Texas monthly payment—fund a sprawling apparatus of roughly 5,000 taxing units generating $89.4 billion in 2025 levies (Bonura, 2026). Insurance, increasingly the dispositive variable, is shaped by catastrophe exposure, reinsurance pricing, and building-code regimes that purport to mitigate loss but often add expense without commensurate benefit.
Although roughly one-third of U.S. home sales close in cash, those transactions concentrate at the extremes of the price distribution, either entry-level homes under $100,000 or luxury properties above $1 million (Jones, 2025). The core of the market depends on financing, which means the cost of staying in a home is functionally a monthly payment problem, not a sticker-price problem.
The PITI+ frame has direct policy implications. Reducing sticker price by 5% through, say, looser lot-size rules is meaningful but insufficient if simultaneous insurance increases of 18% push the monthly payment higher. Property tax compression at the school district level, the central thrust of the 88th Legislature’s SB 2, has attempted to provide substantial relief in the past; however, the actions of local governmental entities have largely prevented that relief from taking root. The right reform agenda should address and measure multiple PITI+ components.
Levers and Limits of State-Level Policy
The Texas Constitution vests broad regulatory authority in the Legislature, but home-rule cities possess wide discretionary powers subject only to limitations enacted by the Legislature. The state, in other words, can preempt cities. It has chosen not to do so for most of the 20th century with limited exceptions. The 89th Legislature represented an inflection point on housing, a deliberate exercise of the preemption power against cities whose local rules had become barriers to housing supply (Crockett et al., 2025).
The case for state-level action rests on two foundations. First, on first principles: zoning powers are delegated by the state to the city, and the state retains the right to alter the delegation. Second, on practical grounds: the externalities of local exclusion are regional, and the families excluded from one suburb are pushed onto the housing markets of neighboring jurisdictions or onto the highway commute that follows. Localism is a virtue. It is not, however, a license for cities to constrain the supply of housing below the level required by the state’s population trajectory.
Within those bounds, two principal levers remain. The first is regulatory intensity. Reducing the friction associated with land-use rules, platting, site-plan review, parking mandates, and design requirements lets the market deliver homes across a wider range of price points. The second is property tax burden. Because Texas finances local government primarily through property levies, even modest reductions in effective property-tax rates translate directly into lower monthly carrying costs for both new and existing homeowners. Mortgage rates, regulations promulgated by national bodies, and federal mortgage-finance rules sit largely outside state authority. Policymakers would be wise to see the 2025 reforms as a floor, not a ceiling.
Housing Market Indicators
Several indicators can be used to glean a greater understanding of a housing market’s condition. The conventional taxonomy organizes them into leading indicators, those that show whether the system is positioned to deliver supply before prices spike, such as permits, plats, local approval times, and financing conditions; and contemporaneous indicators, those that describe current market tightness, such as inventory, days on market, and transaction volume.
Within those two categories, six signals generally characterize a housing market. The leading indicators—population growth, mortgage rates, and permitting—tell us where the market is heading. The contemporaneous indicators—sale prices, inventory and days on market, and consumer confidence—tell us where it stands today. The following list organizes these alongside two emergent indicators—permitting volumes and insurance premiums—that have become decisive in the post-2020 Texas market.
Job and Population Growth
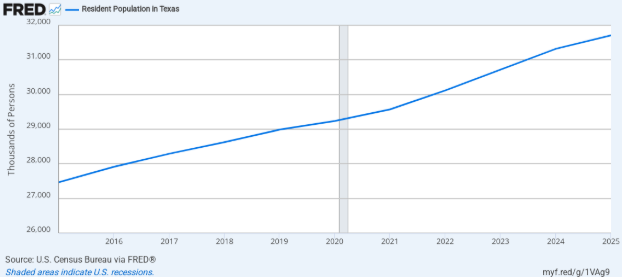
Population is the foundational demand-side indicator. Every other variable in the housing market—prices, permits, rents, days on market—is, at root, a function of how many people are demanding shelter and how much they can afford to pay for it. Texas has been the country’s demographic engine for a generation, and even at a moderating pace, it remains so. The state’s resident population reached 31,709,821 as of July 1, 2025, the latest Vintage 2025 estimate from the U.S. Census Bureau, an increase of 391,243 over the prior year, more than any other state for the 15th consecutive year (U.S. Census Bureau, 2026). Yet, that headline obscures a softening underneath. The 1.2% growth rate was the slowest since 2021, and Texas slipped from first to fourth place by percentage growth, behind South Carolina, Idaho, and North Carolina (Fechter, 2026).
Figure 1
Texas Population Growth, 2015–2025
Note. Data from U.S. Census Bureau via FRED, https://fred.stlouisfed.org/series/TXPOP
The composition of growth has also shifted in ways that matter for housing demand. Net domestic migration—the engine that delivered 222,154 new Texans in 2022—fell to 67,299 in 2025, behind North Carolina for the first time in modern memory. Net international migration to Texas dropped roughly 48% year-over-year to 167,475, mirroring a national 53.8% collapse driven by enforcement-related changes (U.S. Census Bureau, 2026). Natural change contributed 157,111 residents (390,203 births against 232,492 deaths). Since 2020, Texas has added 2.6 million residents, more than any other state, with over two-thirds of that growth attributable to migration. The Texas Demographic Center (2025)continues to project that the state will surpass 40 million residents by mid-century under its baseline migration scenarios.
Job growth has decoupled from population growth in a way the state has not seen since the dot-com hangover of 2002–03. Texas employment grew just 0.1% in 2025, adding only 10,700 jobs, well below the state’s 2% long-term average (Federal Reserve Bank of Dallas, 2026a, update revised its 2026 forecast down to 1.4% growth—roughly 215,000 jobs—within a confidence band of 0.7 to 2.1%, citing constrained labor supply from declining immigration, productivity-driven softness in labor demand, and elevated geopolitical uncertainty (Federal Reserve Bank of Dallas, 2026b). Leigh and Orrenius (2026) framed the period as “low-hire, low-fire,” with output and productivity rising even as headcounts stagnate. Among major metros in 2025, Austin led at 0.9%, and San Antonio trailed at –0.6%. The Texas Workforce Commission’s (2026) MSA-level series and the Dallas Fed’s Texas Business Outlook Surveys remain the highest-frequency tools for tracking this slowdown.
Interest Rates
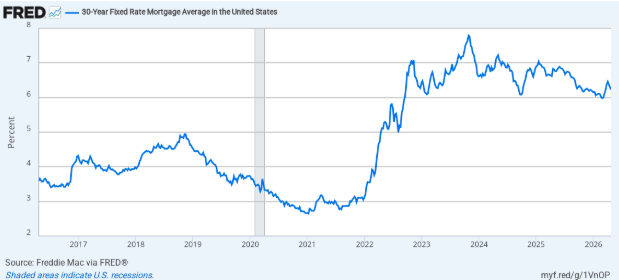
Mortgage rates determine effective buying power. When rates fall, otherwise marginal buyers qualify for larger loans and a wider price range; when rates rise, the same households are priced out even if list prices do not change. The average 30-year fixed-rate mortgage stood at 6.23% for the week ending April 23, 2026, down from 6.30% the prior week and from 6.81% a year earlier (Freddie Mac, 2026). While these rates remain well below the post-2022 peak, they remain meaningfully above the 3% to 4% range that prevailed for most of the decade preceding the pandemic.
Figure 2
30-Year Fixed Rate Mortgage Average in the United States, 2017–2026
Note. Data from Freddie Mac via FRED, https://fred.stlouisfed.org/series/mortgage30us
Mortgage rates closely track the 10-year Treasury yield, which serves as the principal benchmark for long-duration consumer credit. The 10-year Treasury hovered near 4.3% in late April 2026 (Board of Governors of the Federal Reserve System, n.d.-b). The persistent spread between the 10-year Treasury and the 30-year fixed mortgage rate has remained well above the historical average of roughly 170 basis points, keeping mortgage costs elevated even when underlying Treasury yields have moderated.
Why does the rate matter so much? At a $321,000 median sale price with 20% down and a 6.23% rate, principal and interest alone run roughly $1,580 per month on a 30-year fixed. At 5.5%, the same loan costs $1,460 per month, a $120 monthly savings, or about $43,000 over the life of the loan. That is roughly the magnitude by which the most aggressive zoning reform might reduce the median sticker price. Monetary conditions sit largely outside the state’s control, so state policy must focus on the components of the monthly payment that the state can influence directly: property taxes, insurance regulation, and the recurring local charges associated with homeownership.
Permitting
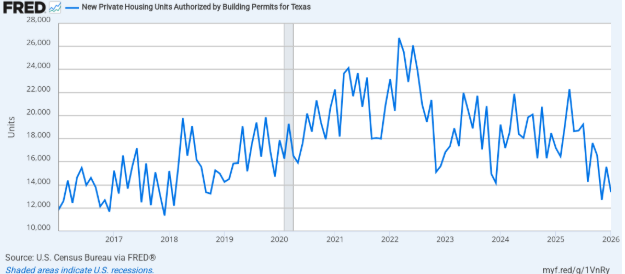
Permitting is the most direct leading indicator of future housing supply. A new permit issued today represents a unit that may be financed, framed, and occupied within roughly 12 to 18 months for single-family construction and 2 to 3 years for multifamily construction. Texas authorized 225,756 new private housing units in 2024, more than any other state (U.S. Census Bureau, 2025). Monthly readings from the FRED TXBPPRIV series show the post-2022 deceleration in real time: 17,624 units in September 2025 falling to 13,365 in January 2026 (U.S. Census Bureau, n.d.).
Figure 3
New Private Housing Units Authorized by Building Permits for Texas, 2017–2026
Note. Data from U.S. Census Bureau via FRED, https://fred.stlouisfed.org/series/houst
Permit volume is necessary but not sufficient. A permit issued does not guarantee that a unit will be platted, financed, and built within a useful timeframe, and Texas does not yet publish standardized data on the median time between permit issuance and certificate of occupancy. Sustained permit volume in growth metros remains the single best leading signal that the state’s supply pipeline has not collapsed. Permit data should be evaluated alongside finished-lot inventory and starts data to distinguish administrative throughput from actual unit delivery, since a permit that sits unused for 18 months provides no meaningful affordability relief. Texas was the state with the highest number of single-family permits issued (approximately 149,860) and the highest number of multifamily permits issued (approximately 82,513) in 2023 (NAHB, 2025c), so even small per-unit fee or regulatory increases aggregate to large statewide effects.
Rising Home Prices and Appreciation
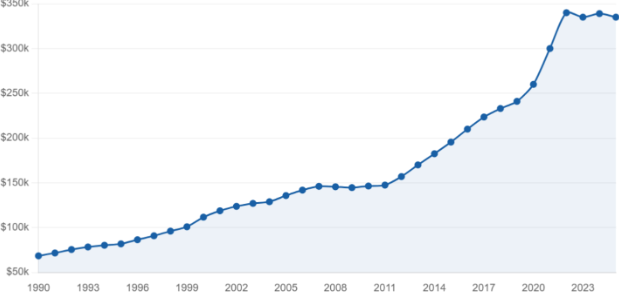
Steady increases in home values signal high demand and a strong seller’s market. The Texas Real Estate Research Center (TRERC) publishes monthly statewide and metropolitan median sales prices through its Housing Activity dashboard (TRERC, n.d.-b). Statewide, the median sales price stood at $321,000 in January 2026, having softened modestly from a 2022 peak of approximately $360,000 (TRERC, 2026a).
Figure 4
Median Sales Price of Homes in Texas, 2017–2026
Note. Data from Texas Real Estate Research Center, https://trerc.tamu.edu/data/housing-activity/?data-State=Texas
Prices are the variable every household actually feels. The TRERC reported a statewide median sales price of $321,000 in January 2026, down 2.7% month-over-month and 1.5% year-over-year, well below the 2022 peak of approximately $360,000 (TRERC, 2026b). TRERC’s 2026 forecast calls for the median to settle near $334,000 by year-end, a 1.3% annual gain that would mark a third consecutive year of disinflation in residential real estate (TRERC, 2026a). The FHFA House Price Index for the West South Central census division—Texas, Oklahoma, Louisiana, and Arkansas—fell 0.7% year-over-year in January 2026 and was the only region to register a 12-month decline of that magnitude, while the U.S. national index rose 1.7% through February 2026 (Federal Housing Finance Agency, 2026). The S&P CoreLogic Case-Shiller Dallas series confirms the deceleration, with annual appreciation in the metro flattening to its lowest reading since 2023 (S&P Dow Jones Indices, 2026).
The metro-level story diverges sharply. Austin prices continue to slide 2 to 3% year-over-year—extending a correction that began in mid-2022, while San Antonio and Houston have turned modestly negative (TRERC, 2026b). The Joint Center for Housing Studies (2025) finds Austin among the few major metros where prices fell most sharply in early 2025. The bitter fruits of the 2020–2022 boom—required income for Texas homeownership rose 167% over the past decade—have not been undone, even where nominal prices are now falling (Texas 2036, 2024).
Low Inventory, Fast Sales, and Increased Transaction Volume
Three contemporaneous indicators describe the current pace of market activity. Inventory, measured in months of supply, captures whether a limited supply of homes for sale relative to the number of buyers is producing a competitive market. Days on market (DOM) measures how long, on average, a listed home remains active before going under contract; shorter durations indicate competitive conditions and pricing power for sellers, while longer durations indicate buyer leverage and price flexibility. Transaction volume, or the number of homes being sold in a given period, often alongside low inventory, indicates high market activity.
The median number of days a Texas listing spent on the market reached 82 days in March 2026, up 12 days year over year (Redfin, 2026). Realtor.com data tracked through the Federal Reserve Economic Database (n.d.) show a similar trajectory, with statewide medians climbing through late 2025 and into 2026 after the post-pandemic compression.
Figure 5
Housing Inventory: Median Days on Market in Texas, 2017–2026
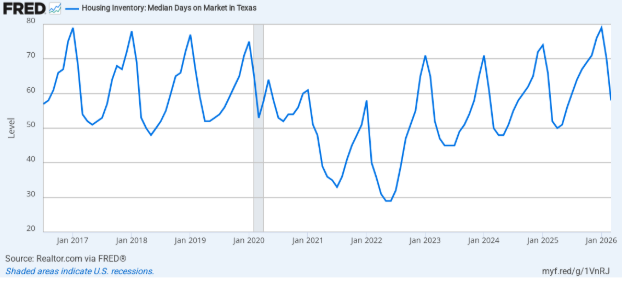
Note. Data from Realtor.com via FRED, https://fred.stlouisfed.org/series/MEDDAYONMARTX
Statewide closing data tells a parallel story. Texas Housing Insight reported 19,193 closed sales in January 2026, a median sale price of $321,000, inventory of 4.7 months, and an average of 80 days on market (TRERC, 2026a). The pre-pandemic norm was three to four months of inventory; anything above five months is widely considered a buyer’s market. These figures are consistent with the gradual normalization of a market that ran historically hot during the pandemic period, but they should not be confused with a return to broad affordability. Longer days on market and rising inventory reflect demand suppression by elevated payment costs as much as they reflect genuine supply expansion. A market can simultaneously appear softer on these contemporaneous indicators while becoming less affordable on a monthly payment basis, which is why days on market and inventory must always be read together with the financing and insurance indicators below.
Consumer Confidence
Confidence is the bridge between what the data says and what households actually do. Four canonical measures together provide a forward read on consumer behavior. The Conference Board’s Consumer Confidence Index, drawn from a 3,000-household monthly survey first published in 1967, ticked up 0.6 points to 92.8 in April 2026, its best reading of the year, though the index remains well below the 100-plus levels associated with a confident consumer (The Conference Board, 2026). The University of Michigan’s Index of Consumer Sentiment, launched in 1946, tells the opposite story: the final April 2026 reading of 49.8 was the lowest in the 74-year history of the survey, dragged down by inflation expectations of 4.7% at the one-year horizon and 3.5% at the five-year horizon, both elevated by the Iran conflict’s energy-price shock (University of Michigan, 2026). The divergence is instructive: the Conference Board indexes weigh current labor-market readings, where conditions remain reasonable; Michigan weights household finances and inflation, where conditions feel terrible.
Two housing-specific gauges fill in the picture. The Fannie Mae Home Purchase Sentiment Index—distilled from six questions on the National Housing Survey—has been discontinued, but the last several releases before then were hovering in the 70s, with the September 2025 release showing modest improvement on selling-conditions expectations even as buying-conditions sentiment remained deeply pessimistic (Fannie Mae, 2026).
Figure 6
NAHB/Wells Fargo Housing Market Index, 2015–2026
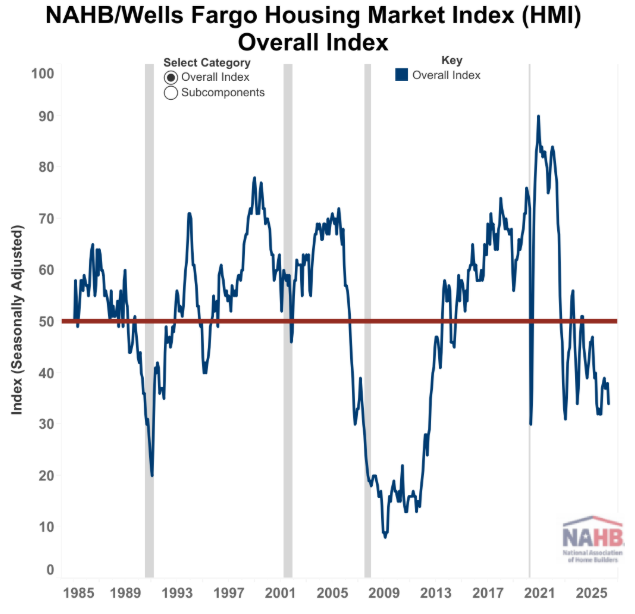
Note. Data from National Association of Home Builders, https://www.nahb.org/news-and-economics/press-releases/2026/04/builder-sentiment-posts-notable-decline-on-economic-uncertainty
On the supply side, the NAHB/Wells Fargo Housing Market Index—which polls single-family builders monthly on present sales, six-month sales expectations, and traffic of prospective buyers—fell four points to 34 in April 2026, the lowest reading since September 2025 and the seventeenth consecutive month below the 50 threshold that separates expansion from contraction (NAHB, 2026b). Builders cut prices in 36% of cases in April, with average reductions of 5%, and 60% reported using sales incentives, the thirteenth straight month at that elevated share.
Figure 7
Fannie Mae Home Purchase Sentiment Index (HPSI), 2015–2025
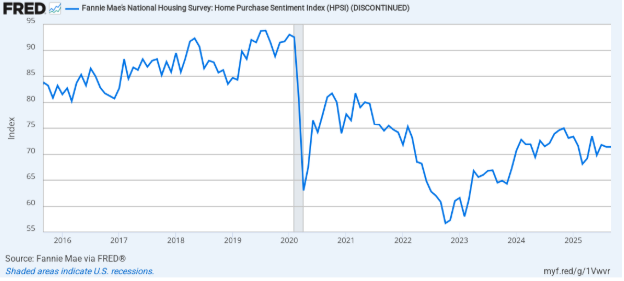
Note. Data from Fannie Mae, https://www.fanniemae.com/data-and-insights/surveys-indices/national-housing-survey
The Texas-specific complement is the Dallas Fed’s monthly Texas Business Outlook Surveys, which now show “moderating” business activity with services-sector firms reporting elevated price pressures, and the Texas Workforce Commission’s monthly MSA employment series, which runs roughly two months ahead of national household surveys for state-level diagnostic purposes (Federal Reserve Bank of Dallas, 2026b). Together, these readings suggest a consumer who feels squeezed by prices but secure in employment, a profile consistent with the Texas Real Estate Research Center’s (2026b) observation that buyer demand is “still weak and constrained” while sellers, sensing the start of a normalization, are returning to listings in numbers. The lesson for policy is that confidence is downstream of fundamentals. No marketing campaign or rate-buydown gimmick will lift sentiment durably while the all-in cost of homeownership consumes 40% to 50% of median income. The fix runs through supply.
Insurance: An Emerging Indicator
If 2024 was the year insurance entered the housing-policy conversation, 2026 was the year it became the dominant focus. The single most consequential indicator added to this study’s framework is the property-insurance premium, and the news is sobering. According to American Community Survey data analyzed by Federal Reserve Bank of Dallas business economist Mariam Yousuf, the median Texas homeowner paid 60% more for property insurance in 2024 than in 2019 (Yousuf, 2026). The national median figure rose 30% over the same period, meaning Texas premiums grew at twice the national rate.
A separate Dallas Fed paper published March 24, 2026, links insurance premiums to mortgage performance using ICE McDash data covering 6.7 million borrowers from 2015 to 2023 (Ge et al., 2026). Three findings warrant policymaker attention. First, insurance now constitutes roughly 14% of the typical mortgage payment in 2025, up from 10% in 2013, an increase of 40% in the relative weight of insurance within PITI. Second, premium increases pushed approximately 31,000 mortgages into delinquency in 2022 alone, a year not associated with any unusual macroeconomic stress. Third, the authors project that continued premium growth could push an additional 203,000 mortgages per year into delinquency between 2025 and 2055, based on First Street Foundation premium projections of 29.4% average increases by 2055.
Texas premium dynamics carry several distinctive features. The state’s catastrophe exposure—hailstorms across the Hill Country and North Texas, prolonged Arctic blasts of the 2021 Winter Storm Uri type, hurricanes on the coast, derechos like the May 2024 Houston event—means that reinsurance pricing translates directly into Texas primary-market premiums. Construction-cost inflation since 2020 (still well above pre-pandemic levels) compounds claim severity. Insurance availability—not just affordability—is increasingly a constraint on homeownership in coastal Texas, parts of the Rio Grande Valley, and high-hail-risk areas of the Panhandle. The escrow account by which most homeowners pay both property tax and insurance creates a delivery mechanism through which insurance shock translates almost mechanically into mortgage delinquency.
Housing Market Challenges
Texas’s housing affordability challenges arrange themselves into three pillars: overregulation, taxation, and a long tail of “death by a thousand cuts” governmental interference—under a fourth, federal layer of policy that has repeatedly reshaped credit, prices, and demand. Each pillar interacts with the others.
Overregulation
The Role of Regulation in Housing Costs
Government regulation operates as a tax on housing without ever appearing on a tax bill. Compliance costs imposed during land development and home construction are capitalized into the final sales price of the home, then financed at prevailing mortgage rates over a 30-year amortization. The result is that even modest regulatory burdens at the front end translate into materially higher monthly payments for the end-purchaser.
Impact on New Single-Family Homes
The locus classicus of the regulatory-cost literature in residential construction remains the National Association of Home Builders’ 2021 study by Paul Emrath, which estimated that government regulation accounts for 23.8% of the price of a typical new single-family home, roughly $93,870 per home at the survey’s reference price point (Emrath, 2021). The 23.8% headline figure is 44% higher than the 2011 estimate and 11% higher than the 2016 estimate, indicating that the regulatory burden has been compounding even as the underlying market has tightened.
That total breaks into two distinct phases. Lot development imposes 14.6% of the final sales price ($41,330), driven by impact fees, utility hookup fees, stormwater regulations, design standards beyond what the developer would otherwise build, regulatory delay, affordable-housing fees, and dedications of land for parks and open space. The construction phase that follows lot purchase imposes another 9.7% ($52,540), with changes to building codes over the past ten years alone accounting for more than $24,000 per home, the single largest line item in the entire study (Emrath, 2021).
Impact on Multifamily Housing
The regulatory burden is even more pronounced in the multifamily sector, where renters absorb the cost as higher rent rather than purchase price. The most recent joint study by the National Association of Home Builders and the National Multifamily Housing Council finds that government regulation accounts for an average of 40.6% of total multifamily development costs, up from approximately 32.1% in their prior survey, a rise of nearly nine percentage points in a single survey cycle (National Association of Home Builders & National Multifamily Housing Council, 2022). Within that 40.6%, building code changes over the past decade alone account for 11.1% of total project cost, costs imposed when site work begins for 8.5%, design standards beyond what the developer would otherwise do for 5.8%, and post-site-work permit and utility hookup fees for 4.6%.
Where local jurisdictions impose inclusionary-zoning mandates—required only on 38.8% of projects, but consequential where applied—they raise development costs by 6.9% on average for affected projects and force market-rate rents on the remaining units to be 7.6% higher than they would otherwise be. Three out of four multifamily developers also report encountering organized neighborhood opposition during entitlement; that opposition adds an average of 5.6% to total project cost and 7.4 months of delay. The behavioral response is unsurprising: 47.9% of multifamily developers avoid jurisdictions that impose inclusionary zoning, and 87.5% avoid jurisdictions that impose rent control. Capital flows to where it is welcomed.
Common Classifications of Housing Regulation
Although the popular debate often treats housing regulation as a single phenomenon, the federal research literature has long recognized that it operates through five reasonably distinct channels. The U.S. Department of Housing and Urban Development’s Cityscape volume on regulatory barriers identifies these as building codes, governing the structural, life-safety, and habitability standards a finished home must meet; land-use and zoning regulations, governing where, in what density, and in what form housing may lawfully be built; subdivision rules and impact fees, governing how raw land is divided into developable lots and how the public infrastructure costs of new development are allocated; environmental regulations, governing the treatment of wetlands, drainage, endangered species, historic resources, and similar features; and regulatory process and implementation barriers, encompassing the platting, site-plan review, variance, and permitting procedures through which substantive rules are administered in practice (Schill, 2005). Each category contains trade-offs that legitimate public purposes can justify, but the cumulative weight of all five is the proper unit of analysis. A jurisdiction can have moderate rules in any single channel and still impose, in aggregate, a binding constraint on housing supply.
Empirical work supports this characterization. In highly regulated markets, prices substantially exceed the marginal cost of construction, with local land-use regulation the dominant supply-side cause (Glaeser & Gyourko, 2018). The most recent academic evidence likewise confirms that relaxing density restrictions raises housing units by approximately 9% within 5 to 10 years and that adding 1% to new supply lowers average rents by 0.19%, with the largest effects concentrated in lower-quality units (Büchler & Lutz, 2024; Mense, 2025). Texas does not need to import this evidence; it can read it off its own cities.
Rental Market Regulation
Those in the market to buy a home are not the only ones affected by the affordability crisis. Renters face their own challenges imposed by poor government policy choices. Cities across Texas have a number of ordinances that not only limit the ability of developers to add to housing supply—thus keeping rental prices less competitive—but also, in some cases, tell citizens with whom they can live. Renting can be understood as pre-homeownership, a stage in which individuals or families learn to take care of a home and save for something that can be theirs. The problem is that in Texas, rent approaches (and in some instances, nearly matches) the monthly payment of a mortgage. This reality prevents people from saving enough to put down payments on homes whose prices are continuously growing out of reach. According to research from the Texas Real Estate Research Center (2026b), nearly every major city in Texas has surpassed the threshold of what is considered affordable—30% of household income.
Overburdensome regulation at the local level is a large contributing factor to the increase in rental costs. The Texas Legislature has passed a number of bills aimed at fostering an environment in which more supply could be created. SB 840 (2025) allowed the mixing of residential and commercial zoning to encourage vertical mixed-use multifamily developments with commercial space on the bottom floor—a boon for cities, especially in their central business districts, revitalizing downtowns and maximizing limited space. The bill also allowed the conversion of empty office space to housing units, by right, utilizing the roughly 20% of office space currently unused in each of Texas’s five most populous cities. Even with this directive from the state, cities have continued to resist the bill’s implementation, adding “poison pill” requirements—such as extravagant amenities including Olympic-size swimming pools and dog parks inside the complex—that run contrary to the spirit of SB 840 and further restrict the supply of housing, preventing prices from responding realistically to actual consumer demand.
The Legislature also passed SB 1567 (2025), which prohibited cities from enforcing ordinances or rules that placed occupancy limits on dwellings based on the familial status of roommates. Typically, the number of unrelated people allowed to rent together had been limited to a fixed number regardless of unit size, while related occupants were permitted two people per bedroom—so a unit with four bedrooms could house up to eight related people, but cities could cap unrelated occupants at four. SB 1567 permitted occupancy limits of one person per 70 square feet of sleeping area plus an additional person for every 50 square feet of space in the sleeping area, making it easier for people to find roommates to split rents and making housing more affordable. The Legislature could strengthen this policy by extending the directive to all home-rule cities; currently only cities with a university campus and a population of 250,000 or more are required to follow it, leaving much of the state subject to discriminatory occupancy standards that keep affordable rent out of reach.
Accessory Dwelling Units
Local government obstruction of private property rights does not hamper only large developers; it also prevents individuals from maximizing the value of their own property. One example is municipal regulation of accessory dwelling units (ADUs)—smaller secondary housing units built on the same lot as a principal dwelling (Crockett et al., 2025)—which cities commonly regulate harshly or prohibit outright. The effect is an artificially constrained housing supply, leaving the area workforce with higher prices and fewer choices. By limiting or removing municipal regulation of ADUs, the Legislature would provide property owners with several advantages. Property owners who seize the opportunity can gain a new passive income source by renting out their ADUs. ADUs can also serve as a way for elderly family members—who typically downsize after their nest empties—to live near family while maintaining independence and privacy. And property owners can benefit from increased home equity by building an improvement that adds value to the entire property.
Legislation that would have allowed ADU construction by right was narrowly defeated during the 88th Legislative Session, and although SB 673 (2025) emerged from the House committee in the 89th Session, the bill sat on the General State Calendar until the session ended. If addressing the housing affordability crisis is indeed a goal of the Legislature, a bill allowing by-right construction of ADUs must pass in the 90th Legislative Session.
Taxation
The Role of Taxation in Homeownership Costs
Where regulation is capitalized into the purchase price of a home, taxation is paid year after year for as long as the homeowner remains in the property. Property taxes therefore occupy a uniquely persistent place in the lived cost of housing, and they are unusually consequential in Texas, where local governments are financed primarily through property levies. Even modest reductions in effective property tax rates translate directly into lower monthly carrying costs for both new and existing homeowners; conversely, even moderate increases compound across the life of the mortgage.
The Impact of Property Taxation in Texas
The Tax Foundation’s 2026 ranking places Texas with an effective property-tax rate of 1.47% on owner-occupied housing, among the highest in the United States and well above the rates in peer Sun Belt states such as Florida and Arizona (Yushkov, 2026). On the Tax Foundation’s 2026 State Tax Competitiveness Index, Texas ranks 7th overall but 40th specifically on property taxes, a striking divergence reflecting the structural pattern of trading income-tax exemption for elevated property levies. Within the state, county-level effective rates range from 0.22% in Borden County to 1.80% in El Paso County, while median property taxes paid run from $400 in McMullen County to $7,727 in Travis County.
The growth trajectory of Texas property taxes is the more pressing concern. Analysis by the Texas Public Policy Foundation finds that, between 2015 and 2024, property tax valuations and levies grew far faster than the combined rate of population growth and inflation in every major Texas city. Austin saw valuations rise 137% and levies rise 120% against population growth of just 17%; San Antonio recorded valuation growth of 90% and levy growth of 81% against 4% population growth; Dallas posted 113% valuation growth and 94% levy growth against 4% population growth (Quintero, 2024). Statewide, property taxes have risen approximately 181% over the past two decades, while the combined rate of population growth and inflation has risen roughly 100%.
The most recent edition of TPPF’s “Just the Facts” research series confirms that the trend has continued, with local governments levying approximately $89.4 billion in property taxes in 2025, distributed across nearly 5,000 separate taxing units (Bonura, 2026). For homeowners, the practical effect is that property tax escalation can offset, and in some jurisdictions overwhelm, any improvement in mortgage-rate or insurance conditions. The 88th Legislature’s SB 2 (2023 (2025) approved by voters in November 2025, added meaningful relief at the school-district and business-personal-property levels, respectively. But county, city, and special-district levies have continued growing faster than population and inflation in nearly every major jurisdiction. However, the structural problem—an ever-expanding base of taxing units, each with its own appetite—remains.
The structure of the tax itself compounds the problem. The property tax is a tax on unrealized gains on an asset that happens to be where a person or family lives, and because spending at every level of local government often outpaces population growth, tax levies are raised to meet these ever-increasing budgets. Debt, both voter- and non-voter-approved, inflates property valuations and drives up property tax bills. This plays heavily into the calculus people employ when deciding where to buy a home—and whether, having made the initial purchase, they can sustain a mortgage alongside property taxes. Homeowners are not the only people priced out of housing by burdensome property taxes. While renters do not pay the property tax directly, the cost of doing business, which includes the property taxes the landlord must pay, is reflected in the monthly rent.
A number of measures are available to the Texas Legislature in the 90th Session to reduce the effects of property taxes on homeownership. First, the same limits placed on the state for tax levy collection, debt issuance, and spending should be extended to cities. Second, increasing transparency through auditing local government spending can help taxpayers make informed decisions about how their tax money should be spent, if it should be spent at all. A novel transparency measure for renters would require landlords to disclose what portion of the monthly rent goes to covering property tax. Finally, property taxes are a function of fiscal responsibility: a real discussion is needed about what the core functions of government are, and cities, counties, school districts, and special-purpose districts should be held to those narrowly defined functions—so that school districts cannot divert resources to speculative real-estate ventures instead of instruction, and cities cannot shift funding from emergency services and policing to other priorities. Governments are not entities with a particular will; like a gas, they tend to grow until they reach the limits of their container. A lid must be placed on the proverbial jar, or the expansion of government will continue choking the housing market.
Other Forms of Government Interference in the Marketplace
Beyond direct regulation and taxation, three additional categories of government action raise the cost of housing or constrict its supply: public acquisition of developable land, the cumulative effect of small-bore municipal mandates, and the fee-and-permit regime through which local governments administer development.
Public Acquisition of Affordable Properties
When local governments purchase land that the private market would otherwise develop into housing, the consequence is a permanent reduction in the supply of homes. The City of Austin has been a notable practitioner. Public Information Act records show that Austin has purchased more than 28,000 acres of raw land outside its corporate boundaries over the past two decades (Quintero, 2021). In one example, Austin officials initially fought a developer’s proposal for 1,000 homes on an environmentally sensitive tract in Hays County before reaching a deal to buy and preserve the land instead, converting 1,000 units of would-be supply into permanently undeveloped open space. Whatever the conservation merits of any particular acquisition, the pattern matters for affordability: debt-financed municipal purchases remove developable acreage from the market, push lower-income commuters farther from job centers, and erode the property tax base of the unincorporated communities and adjacent jurisdictions that lose the parcels.
Death by a Thousand Cuts
Many of the regulations that most affect housing affordability are individually small, individually defensible, and cumulatively decisive. Austin alone has accumulated a roster of such requirements: a proposed mandate that certain homes and apartments install insect screens on doors and windows at roughly $35 per opening plus installation; a $1,500 solar-ready requirement per home; a $2,000 visitability ordinance per home; and tree-preservation rules whose total cost is hard to quantify but often amounts to a princely sum (Quintero, 2018). No single one of these mandates is dispositive. Stacked, they are. The cumulative effect amounts to death by a thousand cuts for low- and middle-income Austinites. The same pattern appears in property tax escalation at the local level: between 2007 and 2008 and the time of the analysis, the average city portion of the tax bill on an Austin home grew by approximately 80%, even though the rate of population growth was a fraction of that figure (Quintero, 2018).
Fees
Local development fees deserve particular scrutiny because they are easily overlooked, easily raised, and capitalized directly into the purchase price of new homes, at which point they are financed at prevailing mortgage rates and reappear in monthly payments for the life of the loan. The disparity in fee burdens across Texas cities is striking. According to a published comparison, total development fees for a four-story, 322-unit apartment complex came to more than $1 million in Austin but only about $120,000 in Dallas for the same project (Quintero, 2018). Austin’s commercial building plan review fee alone is structured as $655.20 plus $1.30 for every $1,000 in labor and materials, a base-plus-variable formula that scales aggressively with project size.
More recently, the City of Austin’s FY 2025–26 proposed budget contains permitting fee increases of over 200% on multiple categories, including a 95.5% increase in the base fee for site-plan review and a striking 9,077.2% increase on certain utility-line and street-and-drainage fees for projects with linear footage above 5,000 feet (Texas Public Policy Foundation, 2025a). Texas should accordingly stop treating fees as administratively neutral. They are housing policy, and policy of the most regressive variety, paid disproportionately by buyers of new homes, who tend to be younger, more leveraged, and less able to absorb the increase.
Permitting Delays
Time is itself a cost. Every additional month a project sits in plat review, site-plan review, or building-permit review increases carrying costs, raises the breakeven price at which a developer will commit to building, and pushes some projects below the threshold of feasibility entirely. Comparative data on permitting timelines paints an unflattering picture for the largest Texas cities. In Austin, regulatory delays add an average of 3.5 months to an already four-month-long permit approval process; the comparable figure in Denver is three weeks, and in Raleigh, North Carolina, less than one week (Texas Public Policy Foundation, 2021). In Harris County, businesses report opening delays of up to six months attributable to the approval process.
Texas law already recognizes that these timelines matter. Chapter 212 of the Local Government Code requires municipalities to approve, approve with conditions, or disapprove a plat within 30 days; Chapter 245 protects vested rights once an application is filed; and Chapter 395 governs impact fees and limits their lawful use (Tex. Loc. Gov’t Code § 212.009). The state does not yet maintain a public compliance dashboard showing whether local governments actually process applications within statutory deadlines, with what fee schedules, and with what consistency. That data gap weakens enforcement and prevents the Legislature from distinguishing legitimate infrastructure management from de facto growth control.
Federal Policy and Market Interventions
When governments become involved with the free market, their resources and authority can create shocks to the system that affect prices for decades. Within the first two decades of the 21st century, there were two such major interventions: the collapse of the housing market and the COVID-19 pandemic. Federal policy choices made to mitigate both events directly contributed to the increase in home prices.
The global financial crisis that began in 2007 involved the collapse of several markets that propped up the American financial system. Mortgage brokers facilitated loans to borrowers who would not previously have qualified because the rate of home prices was rising so quickly that, even if the borrower defaulted, the sale of the home would more than cover the original borrowed amount. When prices fell, defaults on these risky loans multiplied and many homes were short-sold, or sold for less than the amount borrowed, leaving brokers and lending institutions—including the government-sponsored enterprises Freddie Mac and Fannie Mae—unable to recoup their losses and prompting federal intervention. In November 2008, the Federal Reserve initiated a plan to stabilize falling housing prices by injecting liquidity into the system and buying “toxic assets” from banks. While this served as a temporary stopgap, the result was to insulate housing prices from the contraction other markets experienced that did not receive the same degree of government intervention. In 2010, the Dodd-Frank Act was enacted to protect consumers and the market from another subprime bubble by tightening underwriting—in hindsight an overcorrection, as new underwriting formulas eliminated a substantial volume of non-government-guaranteed mortgages. Available credit is much lower today than in 2006, displacing many would-be homeowners from the for-sale market into the rental market.
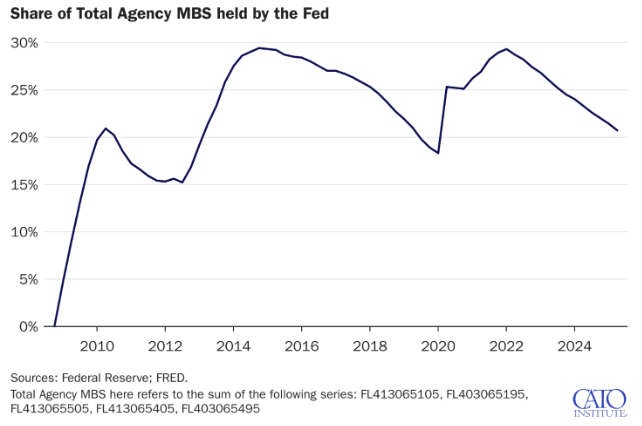
The second destabilizing event was the response to the COVID-19 pandemic. The lockdowns instituted to flatten the curve of transmission produced their own crisis, in which businesses closed, people lost their jobs, and the economy slowed to a stop. To combat the looming recession, the federal government issued a series of measures—including direct refund checks, back-rent reimbursement, and an eviction moratorium—that fueled inflation rising far faster than wages. The result for housing prices was a departure from gradual year-over-year increases to a sharp surge: between 2019 and 2022, the median home price rose from $256,000 to $344,000, and the share of homes priced under $350,000—the pricing widely considered typical of the starter home—fell from 55% to 37% (NAR, 2025b). From the height of supply to its lowest point over the past decade, the number of homes priced at $350,000 and under across the country fell from 952,110 in 2016 to 150,801 in 2022; as of 2026, the supply of homes at prices conducive to new entry into the market remains less than half of what it was in 2016.
The presence of institutional capital from large firms has become a focal point in federal housing policy. These firms came under scrutiny following a headline-grabbing claim that private investors purchased 44% of homes in 2023 and would purchase 60% of homes by 2030. SFR Analytics (2024) investigated the claim and found it unsupported by the data, with home buying among the top 10 firms actually decreasing over 2023. Data from Freddie Mac Economics & Housing Research and John Burns Real Estate show that, combined, small investors (those purchasing 1–9 homes in a 12-month period), mid-level investors (10–99 homes), and institutional investors (100+ homes) account for roughly 30% of all home purchases (Mohtashami, 2023). Broken down by tier, the largest share is attributable to small investors, while institutional investors peaked at 2.4% in Q2 of 2022, and the very largest investors (those purchasing over 1,000 homes in a 12-month period) held a market share of 0.4% as of Q2 of 2023.
According to Amherst’s tabulation of CoreLogic data, by the end of 2024 Texas had 8.46 million single-family homes, 76.9% were owner-occupied and 15.8% were renter-occupied leaving 614,000 vacant units. Among owners 96.2% of single-family rentals are owned by individuals or smaller investors. Individuals accounted for 85.1% of all single-family home transactions and smaller investors made up 14.35% of all transactions. Individuals made 69.7% of all cash only transactions and smaller investors made 28.54% of all cash purchases.
Policies limiting the number of homes a large firm can build for rent or for sale may appear to prevent a few firms from cornering the market and controlling prices, but these developers are in fact adding to the housing supply. Texas has previously proposed legislation to investigate the impact that institutional buyers have had on the price of housing. Before allowing federal policy choices to influence housing prices further, the Texas Legislature should determine whether institutional buyers have a detrimental effect on affordability before prescribing intervention in the market.
Housing Market Measures of Success
A successful Texas housing policy is one in which supply responds before households are priced out, not after. The practical test is straightforward. Can a median-income household buy a typical home with a sustainable all-in payment? Can a working renter find housing without devoting an excessive share of income to rent and fees? Can entry-level builders deliver homes without navigating a prolonged gauntlet of plats, variances, resubmittals, and fee surprises? The metrics below classify success or failure of housing reforms across three categories: regulatory environment, governmental expenditures, and general affordability. The first two categories examine government action, and the third looks at the impact on Texans. All things being equal, less intensive regulations should equal more affordability, as should lower taxes and fees. But affordability also hinges on certain X factors such as the frequency and severity of natural disasters, interest rates, and trade policy. The state, generally, has no control over acts of God. We take it as a measure of success if the levers the state can control trend in the right direction, and we view affordability gains similarly.
Regulatory Metrics
Minimum lot size
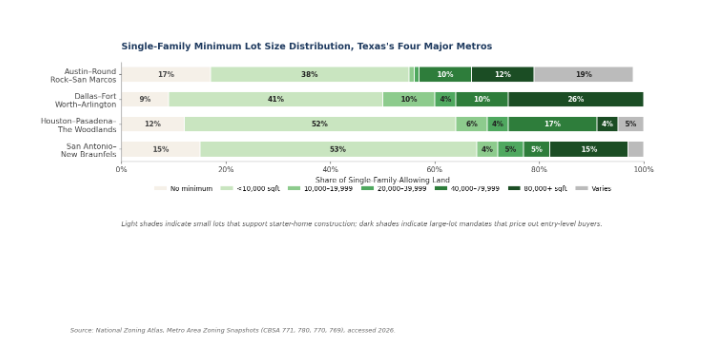
Minimum lot-size mandates are among the most consequential price-setters in Texas residential land use. A regulation requiring the smallest single-family lot to be 5,000, 7,500, or 10,000 square feet operates as a floor on the price of a starter home: the buyer cannot purchase less land than the city is willing to permit, even if the household budget cannot stretch that far.
The National Zoning Atlas (NZA) provides the largest public dataset on these mandates. NZA comprehensively analyzes zoning conditions across 1,482 Texas jurisdictions (National Zoning Atlas, n.d.), and its national findings serve as the comparative baseline. Over half of single-family-zoned land in the United States requires “large lots” of 40,000 square feet—a “builder’s acre”—or more, compared to just 3% associated with “small lots” under 10,000 square feet (Bronin & Markley, 2025). Texas’s distinctive structural feature in the NZA dataset is that counties generally lack zoning authority, leaving large shares of metropolitan land technically unzoned, though in practice housing demand is usually concentrated inside city limits.
NZA’s metro-level Zoning Snapshots for the four major Texas markets reveal sharp contrasts in regulatory posture across the Texas Triangle: 1) Austin–Round Rock–San Marcos; 2) Dallas–Fort Worth–Arlington; 3) Houston–Pasadena–The Woodlands; and 4) San Antonio–New Braunfels.
Metro Austin (population 2.55 million, 54 jurisdictions) zones just 15% of its land area at all. Within that zoned portion, single-family housing is allowed by right on 63% of residential land, but 86% of that land carries some minimum lot size requirement. Twelve percent of Metro Austin’s single-family land requires lots of 80,000 square feet or more, and another 10% requires 40,000 to 79,999 square feet. The accessory-dwelling-unit picture is the most restrictive in the Triangle: ADUs are prohibited on 42% of single-family land. Parking mandates apply to just 37% of residential land, the lowest in the Triangle and a partial reflection of Austin’s 2023 elimination of citywide minimum parking requirements (Markley, 2024).
Metro Dallas–Fort Worth–Arlington (population 8.34 million, 213 jurisdictions) is the most heavily zoned of the four; 28% of land area is subject to zoning regulations, the largest share in the Triangle. The composition of those rules is also the most lot-size-restrictive: 26% of single-family land in Metro DFW requires lots of 80,000 square feet or more, by far the highest share of any major Texas metro, and another 10% requires 40,000 to 79,999 square feet. Together, more than a third of single-family-allowing land in Metro DFW carries large-lot mandates. Missing-middle housing is broadly excluded: 2-, 3-, and 4+-family housing is prohibited on 65 to 66% of residential land. Parking mandates apply to 66% of residential land (National Zoning Atlas, 2026a).
Metro Houston–Pasadena–The Woodlands (population 7.80 million, 138 jurisdictions) is the least-zoned major Texas metro: just 7% of land area is subject to zoning regulations, a direct legacy of Houston’s century-long absence of conventional use zoning, and of Texas’s general policy that unincorporated counties lack zoning authority. Where Houston-area zoning does apply, the lot-size profile is the most permissive of the four metros: 52% of single-family land allows lots under 10,000 square feet, and only 4% requires lots of 80,000 square feet or more. The structural permissiveness on lot size is, however, paired with the strictest parking mandates in the Triangle (76% of residential land) and substantial restrictions on 2- to 4-family housing (70% of residential land prohibits duplexes outright) (National Zoning Atlas, 2026b).
Metro San Antonio–New Braunfels (population 2.76 million, 62 jurisdictions) sits between Houston and DFW: 9% of land area is subject to zoning regulations, but where zoning applies, 53% of single-family land allows lots under 10,000 square feet and 15% requires 80,000 square feet or more. ADU rules are notably permissive; only 13% of single-family land outright prohibits ADUs, the lowest share in the Triangle, though most permissions come with occupancy restrictions (National Zoning Atlas, 2026c).
Figure 8
Single-Family Minimum Lot Size Distribution Across Texas’s Four Major Metros
Note. Data from National Zoning Atlas Zoning Snapshots, accessed September 2026, https://www.zoningatlas.org/snapshots?cbsa=769.
The empirical story of what happens when these mandates are loosened comes from Houston’s own natural experiment. The city’s 1998 reform reduced the by-right minimum lot size for detached single-family homes inside the I-610 Loop from 5,000 square feet to 3,500 square feet, with subdivisions permitted to an average lot size of 1,400 square feet when each lot met open-space and lot-coverage conditions (Hamilton, 2023). The 2013 expansion extended these rules citywide to all land served by wastewater collection. The reform’s political feasibility owed considerably to a block-vote opt-out provision that allowed groups of homeowners to exempt their block from the new minimums by petition, a procedural concession that pre-empted the most vocal opposition without constraining citywide reform (Pew Charitable Trusts, 2023).
The peer-reviewed evidence on outcomes is unambiguous. Hamilton’s Cityscape analysis of the 2013 expansion finds that, “Across many specifications, no evidence emerged that the reform increased land values, and in some models, the evidence showed that the reform reduced land values relative to land in the control group” (Hamilton, 2024 p. 1). The intuition is straightforward: the construction boom that followed reform—nearly 80,000 small-lot homes built citywide—generated enough downward pressure on rents to offset the option-value increase that critics had predicted (Hamilton, 2025). Wegmann, Baqai, and Conrad (2023) document the redevelopment pattern in detail, finding that single-family-to-townhouse conversion concentrated in middle-income neighborhoods and was made politically feasible by the same opt-out provision that shielded existing deed-restricted subdivisions. Mei’s distributional model estimates Houston’s reform delivered a windfall equivalent to $18,000 per single-family household, with lower-income households benefiting most (Mei, 2022). The Mercatus Center’s policy synthesis arrives at the same conclusion: minimum-lot-size reform is the most evidence-backed lever the Texas legislature has (Hamilton, 2024b).
Wharton Residential Land Use Regulatory Index.
If lot size is the most visible regulation, the thicket of regulations is what compounds delay and cost into a death by a thousand cuts. The Wharton Residential Land Use Regulatory Index (WRLURI) is the most authoritative composite measure of that thicket. The 2018 wave by Gyourko, Hartley, and Krimmel surveyed more than 2,800 jurisdictions and constructed a standardized index in which higher values denote more restrictive regulatory environments (Gyourko et al., 2021).
The WRLURI, developed by Joseph Gyourko and colleagues at the Wharton School, aggregates survey responses from local jurisdictions across twelve subindexes, including approval delays, density restrictions, local political pressure, and project review burdens, into a single standardized score (Gyourko et al., 2021). The 2018 wave of WRLURI is the most recent comprehensive national survey and provides community- and metro-level rankings for U.S. housing markets, including the major Texas metros. A successful Texas reform regime would, over time, register as a meaningful decline in the average WRLURI score for covered Texas jurisdictions in any successor wave of the survey.
Governmental Expenditures Metrics
Property taxes.
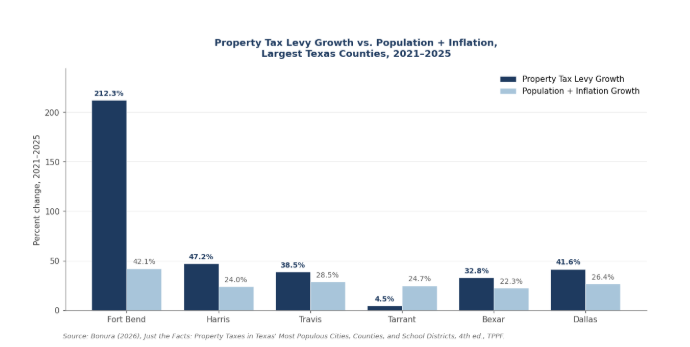
TPPF’s 2026 Just the Facts (Bonura, 2026) report documents that local governments levied approximately $89.4 billion in property taxes in 2025, distributed across nearly 5,000 separate taxing units, and that property tax levies in all but one of the largest Texas counties grew faster from 2021 to 2025 than the combined rate of population growth and inflation; Fort Bend County, the most extreme case, posted a property tax levy increase of 212.3% against population-and-inflation growth of 42.1% over the same period (Bonura, 2026).
Bonura’s (2026) data show Fort Bend County’s property tax levy growing 212.3% from 2021 to 2025—from $374.1 million to $1.17 billion, against a P&I growth rate of only 42.1%. Harris County’s levy grew faster than P&I (24% P&I against a higher levy increase); Tarrant was the only large county where levy growth (4.5%) was below P&I (24.7%). City-level data tell a similar story: Austin’s levy rose faster than P&I, while Houston and San Antonio rose slightly slower; Dallas and Fort Worth rose noticeably faster. The longer-run trajectory is more striking still: from 1998 through 2024, Texas property tax levies grew approximately 364%, while combined population and inflation grew only 149%, a gap between revenue growth and any reasonable measure of fiscal need that compounds, year after year, into the property tax bills that residents see (Texas Policy Research, 2024).
Figure 9
Property Tax Levy Growth vs. Population + Inflation, Largest Texas Counties, 2021–2025
Note. Data from Bonura (2026), TPPF, https://www.texaspolicy.com/wp-content/uploads/2026/04/2026-04-TPP-Just-the-Facts-Debt-FY-2025-Bonura.pdf.
The success metric here is not zero levy growth; it is levy growth that does not exceed the combined growth in population and inflation. Where levy growth outpaces P&I, the state’s voter-approval (formerly known as the rollback tax rate) tax-rate mechanism should be tightened toward the no-new-revenue rate, and the threshold for triggering an automatic election lowered, so that the local choice to grow government faster than the local economy is the local voters’ choice, not an automatic ratchet hidden inside appraisal-driven growth. As Quintero (2025) has argued for over a decade, “Texas is trapped in a cycle wherein the Legislature moves to lower taxes and immediately thereafter, local governments raise taxes through rate hikes, bond elections, and spending commitments.” Without measurement, the cycle is invisible.
Fee growth
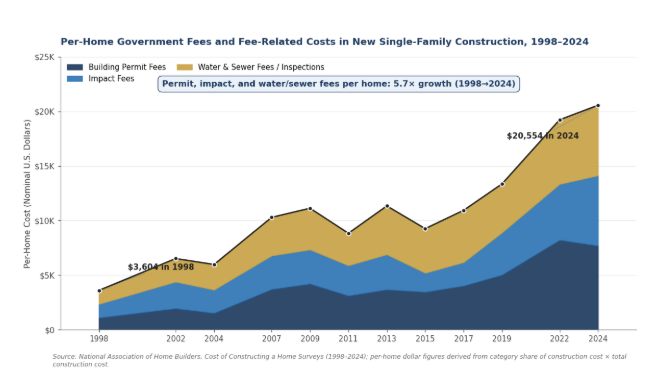
Local fees (e.g., building permit, plat review, impact, water and sewer connection, and inspection fees) function as a tax on new housing and pass through directly into the purchase price of new construction, where they are then financed at prevailing mortgage rates.
The most concrete measurement of how fees on new construction have compounded over the past quarter-century comes from NAHB’s Cost of Constructing a Home survey series, which has tracked builder-paid construction-cost line items every two to three years since 1998. Three line items map directly to government-imposed fees: building permit fees, impact fees, and water-and-sewer fees. The combined per-home dollar burden of these three categories has grown from $3,604 in 1998 to $20,554 in 2024, a 5.7-fold (470%) increase in nominal dollars, well above the rate of general inflation over the same period (Lynch, 2025).
Figure 10
Per-Home Government Fees in New Single-Family Construction, 1998–2024
Note. Permit, impact, and water and sewer fees grew 5.7× in nominal dollars from $3,604 to $20,554 per home. Data from NAHB Cost of Constructing a Home Surveys (1998–2024) and Aauthor’s calculations, https://www.nahb.org/-/media/NAHB/news-and-economics/docs/housing-economics-plus/special-studies/2025/special-study-cost-of-constructing-a-home-2024-january-2025.pdf
The decomposition is instructive. Building permit fees alone grew from $1,118 in 1998 to $7,640 in 2024, a 6.8-fold increase. Impact fees rose from $1,243 to $6,367, a 5.1-fold increase. Water and sewer fees and inspections grew from $1,243 to $6,260, a5.0-fold increase. Each line item compounds the previous: a builder pulling a permit in 2024 pays roughly seven times what a builder pulling a permit in 1998 paid in nominal dollars, on top of impact and water-and-sewer assessments that have grown at similar multiples. None of this captures the regulatory delay cost: the months a builder waits for plan review, the multiple resubmissions a discretionary review process can require, or the carrying cost of land while a project sits in the queue. The NAHB cost survey methodology cannot directly measure those costs. The visible fee growth is the floor of the regulatory burden, not the ceiling (Lynch, 2025).
General Affordability Measures
The combination of market conditions and aforementioned policy decisions drives the general affordability metrics; the improvement of these metrics can be used to gauge the success of housing policy.
Median age of the first-time homebuyer.
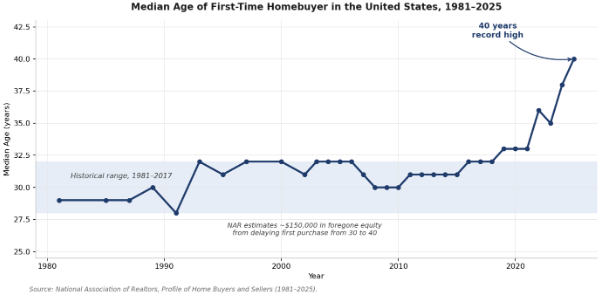
The age at which a typical household enters homeownership for the first time is a downstream indicator of cumulative affordability stress.
Homeownership has been the primary American wealth-building vehicle for nearly a century. When the entry door to that vehicle moves, the demographic, fiscal, and wealth-creation consequences cascade for decades. The National Association of Realtors’ (NARs’) 2025 Profile of Home Buyers and Sellers—surveying transactions from July 2024 through June 2025—records the median age of first-time buyers at 40 years, the highest in the survey’s history; first-time buyers’ share of all transactions stood at 21%, the lowest since NAR (2025a) began tracking in 1981, against a pre-Great Recession norm of roughly 40%. The repeat-buyer median age reached an all-time high of 62, the all-cash share an all-time high of 26%, and the FHA share collapsed from 55% in 2009 to 28% in 2025. NAR estimates that delaying first-time homeownership from age 30 to age 40 represents roughly $150,000 in foregone equity over the homeowner’s lifetime on a typical starter home (NAR, 2025b).
Figure 11
Median Age of First-Time Homebuyer in the United States, 1981–2025
Note. Data from National Association of REALTORS, https://www.nar.realtor/newsroom/first-time-home-buyer-share-falls-to-historic-low-of-21-median-age-rises-to-40
The downstream effects are not merely financial. Acolin, Lin, and Wachter (2024) attribute roughly a quarter of the 9-percentage-point increase in young-adult co-residence with parents between 2000 and 2021 to declining housing affordability, with the effect strongest in the least affordable metros. Dettling and Kearney’s foundational work shows that house-price increases lower fertility among non-owners while raising it among owners. A $10,000 price increase produces a 5% fertility increase among owners and a 2.4% decrease among non-owners, meaning that delayed homeownership is also delayed family formation (Dettling & Kearney, 2014). Recent international and U.S. research extends the finding: housing affordability shapes not just where young families live but whether they form at all (van Wijk & Feijten, 2025). NAR does not publish a Texas-specific median first-time buyer age, and the Texas Demographic Center has not yet constructed an equivalent series; the AEI Housing Center’s mortgage-data tracking shows the median first-time buyer age (mortgage-financed) stable in the mid-30s, a useful complement that highlights the all-cash and credit-tightening dynamics behind the NAR figure (Peter & Pinto, 2026).
Durable progress on supply and payment-side affordability should, with a lag, push the median age of the typical Texas first-time buyer back toward its historical norm.
Cost burden.
The cost-burden ratio defined by the U.S. Department of Housing and Urban Development is the most widely used affordability standard, and the American Community Survey’s Table S2503 (“Financial Characteristics”) supplies the most granular jurisdiction-level measurement (U.S. Census Bureau, 2024a; U.S. Census Bureau, 2024b). The Texas Comptroller’s 2024 Housing Affordability Challenge report, drawing on the 2022 ACS 1-year estimates, found that approximately 34% of Texas households were cost-burdened, with renters substantially more burdened than owners (more than half of renters versus less than a quarter of owner-occupied households). The most arresting figure in the report—and the one that should anchor any honest Texas conversation about cost burden—is the income-bracket distribution: 88% of Texas households with annual incomes below $20,000 were cost-burdened, compared with just 8% of households with incomes of $75,000 or more (Texas Comptroller, 2024a).
Figure 12
Texas Households Cost-Burdened by Income Bracket, 2022
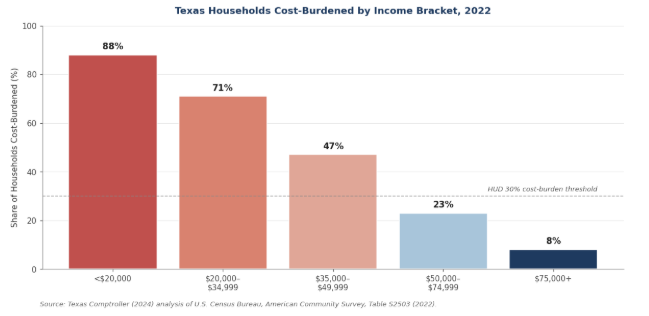
Note. Data from Texas Comptroller (2024) analysis of ACS Table S2503, https://comptroller.texas.gov/economy/fiscal-notes/economics/2024/aff-housing/
Cost burden is not a uniformly distributed phenomenon; it is overwhelmingly concentrated among the lowest-income Texans, and an additional 700,000 Texas households are severely burdened, paying more than 50% of income on housing (Orendain, 2025).
The trend lines have steepened nationally since the Comptroller’s snapshot was taken. The Joint Center for Housing Studies’ (2025) analysis of 2024 ACS data finds 43.5 million U.S. households cost-burdened in 2024, an all-time high, with one in three U.S. households cost-burdened and 21.6 million severely burdened. Cost burdens rose for all homeowner income groups, but the steepest increases were among moderate-income households and older adults; roughly half of newly burdened homeowner households were headed by someone aged 65 or older, where rising property taxes, insurance premiums, and utilities offset the relative stability of fixed mortgage payments. Texas also has just 25 affordable and available rental homes per 100 extremely low-income households, among the lowest ratios in the nation, against a national figure of 34 per 100.
Texas Housing Affordability Index (THAI)
TRERC’s Texas Housing Affordability Index indicates how easy it is to buy a home. It is the ratio of median family income to the income required to qualify for an 80%, 30-year mortgage at the prevailing effective interest rate on the median-priced home, with a 25% qualifying ratio. A value of 1.00 means the median-income family exactly qualifies; values above 1.00 indicate qualifying with margin to spare; values below 1.00 mean the median-income family cannot qualify (TRERC, 2025a). The historical pattern for Texas is unmistakable. In 2016, the statewide THAI stood at 1.66; in 2017 it sat at 1.54; by mid-2018 it had eased to 1.45 (TSAHC, 2019). Broadly, the late-2010s sustained a Texas affordability margin in the 1.45–1.66 range. The 2022 collapse drove the statewide index to roughly 1.04 at its trough as median prices peaked and mortgage rates spiked. The most recent reading, from TRERC’s third-quarter 2025 release, places the statewide THAI at 1.11, up from 1.04 the previous quarter and 1.03 the year prior (TRERC, 2025b).
Figure 13
Texas Housing Affordability Index (THAI), 2017–2026
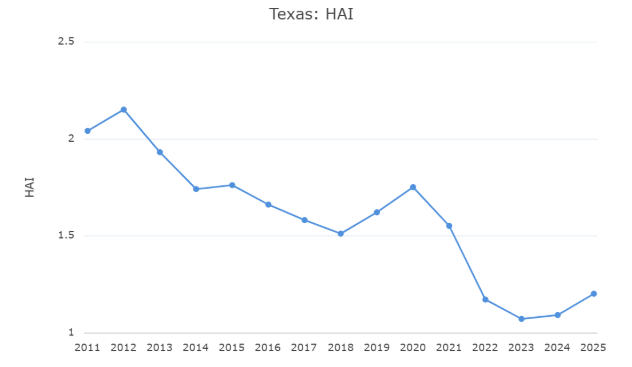
Note. Data from Texas Real Estate Research Center, https://trerc.tamu.edu/article/how-to-use-housing-affordability-index-2275/
The THAI uses a tight 25% qualifying ratio precisely because it does not capture taxes, insurance, or other recurring ownership costs. The actual front-end debt-to-income ratio a Texas mortgage borrower faces, after taxes and insurance, typically runs to 35% or 40%. For first-time buyers using TRERC’s parallel FTHAI series, which assumes a 10% down payment, the Texas reading is structurally lower still, and several major Texas metros (e.g., Brownsville, McAllen, El Paso) saw their FTHAI fall below 1.00 by 2023, meaning a median-income family in those metros could not qualify for a median-priced home (Texas Comptroller, 2024a). The success target should be a sustained recovery of the statewide THAI to 1.30 or above (the floor of the late-2010s comfortable range, accounting for the structurally higher mortgage rates of the 2020s) within five years, accompanied by a metro-level FTHAI floor at or above 1.10 in every Texas MSA. TRERC’s quarterly publication cadence makes the THAI a true real-time scoreboard, and its 45-geography breakdown (e.g., state, 24 MSAs, two metropolitan divisions, 18 counties) supports the granular tracking that reform-by-jurisdiction demands.
Home Ownership Affordability Monitor
While the previously discussed THAI illustrates homebuying affordability, the Federal Reserve Bank of Atlanta’s Home Ownership Affordability Monitor (HOAM) and its cost breakdown data reveal homeownership affordability in fully priced, all-in terms. HOAM measures the share of median household income required to cover principal and interest, property taxes, property insurance, and private mortgage insurance on the median-priced home, with HUD’s 30% threshold normalized to an index value of 100 (Federal Reserve Bank of Atlanta, 2026). Below 100, homeownership is unaffordable for the median-income household; above 100, affordable. As of mid-2025, the national HOAM Index has stabilized in the 47–48% income range, meaning median-priced homeownership consumes 47.7% of median household income, well above the 30% threshold and approximately 60% above what is conventionally considered affordable (TCW, 2025). The income required to afford the national median-priced home stood at roughly $120,000 in mid-2024 against an actual median household income of $85,255, a 40.3% gap.
For Texas metros, HOAM’s monthly cost-breakdown view is the single most useful diagnostic in the entire affordability dashboard, decomposing the all-in monthly payment for the median-priced home into its principal-and-interest, property-tax, property-insurance, and PMI components on a year-by-year basis since 2005. The four major Texas metros tell four distinct stories, but a common one is unmistakable: the all-in monthly payment for the median-priced home rose between 51% and 76% between February 2021 and February 2026 across the Texas Triangle, despite the recent price correction in Austin and DFW (Federal Reserve Bank of Atlanta, 2026).
Figure 14
HOAM Monthly Cost Breakdown, Austin–Round Rock–San Marcos, TX
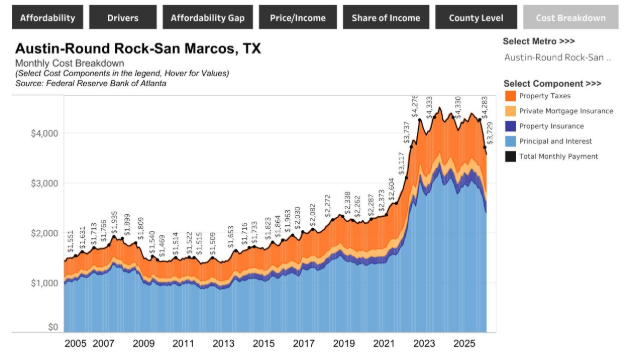
Note. Data from Federal Reserve Bank of Atlanta, https://www.atlantafed.org/research-and-data/data/home-ownership-affordability-monitor
Austin–Round Rock–San Marcos peaked at $4,333 per month in 2024—nearly triple the late-2010s level of around $1,500—driven principally by the 2021–2022 price surge that lifted the metro’s median home price above $550,000. The post-peak correction has been the steepest of any major Texas metro, easing the all-in payment to $3,586 in February 2026, a 51% increase over February 2021 (Federal Reserve Bank of Atlanta, 2026). Austin’s relief comes primarily on the price-and-payment side; the property-tax line continues to climb in absolute terms.
Table 1
HOAM Monthly Cost Breakdown, Austin–Round Rock–San Marcos, TX
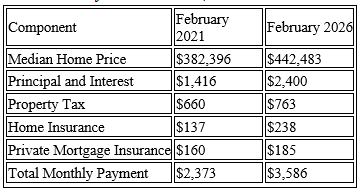
Note. Data from the Federal Reserve Bank of Atlanta, Home Ownership Affordability Monitor, https://www.atlantafed.org/research-and-data/data/home-ownership-affordability-monitor
Figure 15
HOAM Monthly Cost Breakdown, Dallas–Fort Worth–Arlington, TX
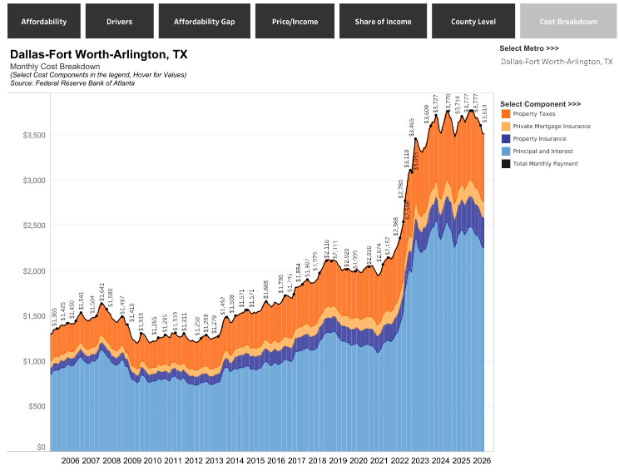
Note. Data from the Federal Reserve Bank of Atlanta, https://www.atlantafed.org/research-and-data/data/home-ownership-affordability-monitor
Dallas–Fort Worth–Arlington reached $3,777 at its 2024–2025 peak before easing to $3,518 in February 2026, a 76% increase over February 2021. The DFW property tax line of $755/month is the single largest dollar tax burden in the four Texas panels, and the property-tax-plus-insurance share of the all-in payment ($1,094 of $3,518, or 31%) makes DFW the most tax-and-insurance-loaded major Texas metro (Federal Reserve Bank of Atlanta, 2026).
Table 2
HOAM Monthly Cost Breakdown, Dallas–Fort Worth–Arlington, TX
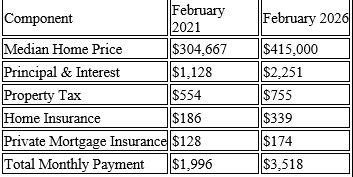
Note. Data from the Federal Reserve Bank of Atlanta, Home Ownership Affordability Monitor, https://www.atlantafed.org/research-and-data/data/home-ownership-affordability-monitor
Figure 16
HOAM Monthly Cost Breakdown, Houston–Pasadena–The Woodlands, TX
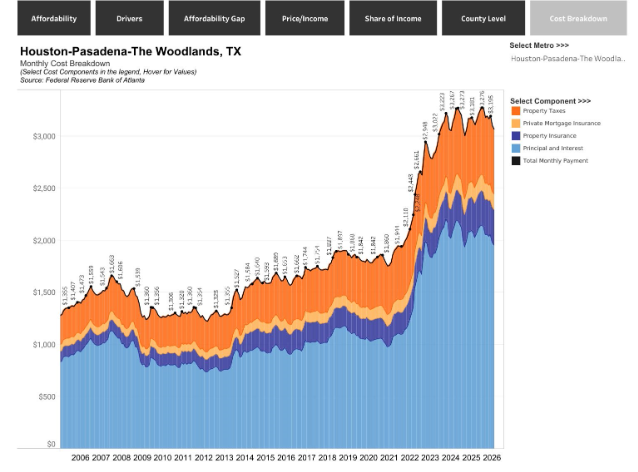
Note. Data from the Federal Reserve Bank of Atlanta, https://www.atlantafed.org/research-and-data/data/home-ownership-affordability-monitor
Houston–Pasadena–The Woodlands peaked at $3,276 in 2025 and now sits at $3,071 in February 2026, a 72% increase over February 2021. Houston’s principal-and-interest component of $1,952/month is lower than two of the four metros despite carrying a $360,000 median price, a legacy of the 1998 and 2013 minimum-lot-size reforms that restrained the Houston price level relative to Austin and DFW. (Federal Reserve Bank of Atlanta, 2026).
Table 3
HOAM Monthly Cost Breakdown, Houston–Pasadena–The Woodlands, TX
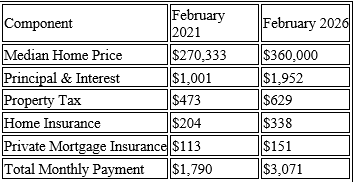
Note. Data from the Federal Reserve Bank of Atlanta, Home Ownership Affordability Monitor, https://www.atlantafed.org/research-and-data/data/home-ownership-affordability-monitor
Figure 17
HOAM Monthly Cost Breakdown, San Antonio–New Braunfels, TX
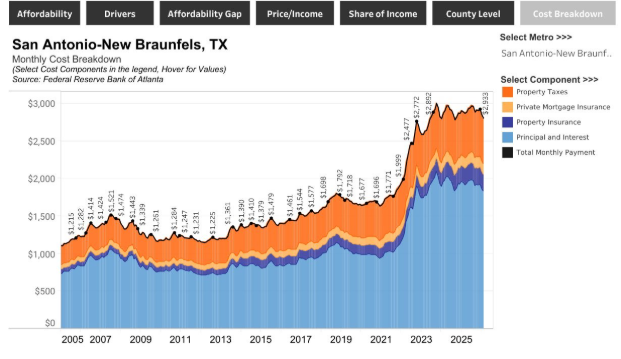
Note. Data from the Federal Reserve Bank of Atlanta, https://www.atlantafed.org/research-and-data/data/home-ownership-affordability-monitor
San Antonio–New Braunfels is the most affordable of the four metros in absolute dollar terms, peaking at $2,892 and currently sitting at $2,813 in February 2026, a 67% increase over the February 2021 baseline of $1,683. The San Antonio panel exhibits the same compositional shift as the rest of the Triangle: principal and interest nearly doubled from $968 to $1,830, while the property insurance line climbed from $130 to $228 as Hill Country hail and South Texas wind exposures repriced through carrier filings (Federal Reserve Bank of Atlanta, 2026).
Table 4
HOAM Monthly Cost Breakdown, San Antonio–New Braunfels, TX
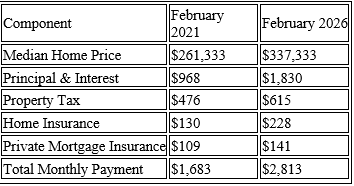
Note. Data from the Federal Reserve Bank of Atlanta, Home Ownership Affordability Monitor, https://www.atlantafed.org/research-and-data/data/home-ownership-affordability-monitor
Two patterns leap out of the four tables read together. First, the structural break between February 2021 and February 2026 is unmistakable across all four metros: the all-in monthly payment rose 51% in Austin, 67% in San Antonio, 72% in Houston, and 76% in DFW, with most of that gap accumulated between 2022 and 2024. Second, the composition has shifted decisively. Property tax shares grew through the late 2010s as appraisal-driven growth outpaced any state relief; property-insurance shares grew sharply post-2022 as carriers raised rates on hail, hurricane, and freeze exposure; and the PMI line remains a modest but persistent drag on the marginal first-time buyer who cannot put 20% down. Recent improvement has been concentrated in Texas; Redfin’s 2024 analysis found Austin posting the largest affordability gain among the fifty largest U.S. metros, with the share of household income needed for monthly housing costs falling from 42.8% in 2023 to 39.6% in 2024 (Worley & de la Campa, 2025), reflecting both price correction and the supply recovery driven by the 2021–2024 building-permit surge. The HOAM cost-breakdown view also exposes the regulatory and quasi-regulatory components of PITI+ most directly: in metros with rising property-insurance rates, and Texas posted the largest five-year percentage-point increase in homeowners’ insurance premiums in the country at the end of 2023, the insurance share of the monthly payment rises, eroding affordability even when prices and rates are stable. The path forward runs through every PITI+ component, and the HOAM panels are the scoreboard.
Conclusion
The cost of buying and owning a home encapsulates many price inputs outside of the control of state and local government: natural disasters that raise insurance premiums, 10-year Treasury bonds that raise interest rates, population and the job growth that follows, and consumer optimism, to name a few. Federal intervention had also added to cost from the 2008 liquidity injection to the pandemic response that have repeatedly reshaped credit availability, prices, and demand from outside the state’s control. The supply can be understood through sales, permitting, starts, days on the market and other indicators. Layered on top of these factors are extra costs created by state and local governments in the form of regulation, taxation, and a long list of creative ways government has artificially inflated prices. Therefore, a sound housing policy must address these challenges to allow for the market conditions to arise to create a state of homebuying affordability and homeowning affordability. Along the way, policymakers would do well to monitor the progress of the state towards these aims. To do so requires monitoring deregulation and tax reduction directly while observing the impact it ultimately has on the market through data on homebuying and homeowning.
APPENDIX A: Definitions
The Texas housing market is populated by a recognizable cast of consumers, providers, financiers, and regulators, and it operates within a thicket of land-use vocabulary that has accreted over a century of municipal practice. What follows is a working glossary for the working policymaker.
Housing Consumers and Providers
Homebuyers are individuals or entities purchasing, or planning to purchase, residential property. Homebuyers can broadly be divided into two overlapping groups: owner-occupants, who seek housing for their own use, and investors, who seek rental income, capital appreciation, or both. In practice, the line between these categories is often blurry. With the rise of home-sharing platforms such as Airbnb, as well as older practices such as single-occupancy rentals and boarding arrangements, a buyer may use the same property for personal occupancy, income generation, or a mix of both (National Association of REALTORS, n.d.). Even owner-occupants are partly investors. In the 2025 Texas Homebuyers and Sellers Report, 78% of Texas homebuyers said buying a home is a good long-term financial investment (Texas REALTORS & Gibbs, 2025). A Zebra survey similarly found that 35% of first-time millennial homebuyers identified building equity as a top reason for purchasing, while 31% cited improving life for their children (The Zebra, 2023).
Home-sellers are individuals or firms supplying residential property for sale. Sellers are divided into owner-sellers, who typically sell an existing residence they occupy or hold, and developer-sellers, who bring newly built units to market. Sellers are most often motivated by life-cycle and household changes rather than purely speculative considerations. The 2025 Texas Homebuyers and Sellers Report found that top reasons for selling included moving closer to friends or family (21%), job relocation (11%), retirement (11%), the home being too large (9%), and the neighborhood becoming less desirable (11%) (Texas REALTORS & Gibbs, 2025). Zillow’s seller research likewise finds that life events, especially changes in household or family size, are among the most common reasons owners decide to sell (Garcia, 2025).
Landlords are owners or operators of residential property who lease housing units to tenants. They vary widely in size, structure, and business model. They include small “mom-and-pop” landlords, family investors, local operators with a handful of units, developers who retain ownership of rental property, and large institutional investors. The Urban Institute notes that mom-and-pop landlords, those owning and managing 10 or fewer rental properties, own more than a third of all U.S. rental housing and often face different constraints than larger firms (Pang et al., 2025). The JCHS (2021) emphasizes that landlords are not a uniform class of market actors but a diverse set of owners with different motivations, portfolio sizes, and operating challenges.
Renters and tenants are individuals or households who occupy residential property owned by another party in exchange for rent under a lease or rental agreement. Renters are the end users of a substantial share of the Texas housing stock and encompass a wide range of household types, income levels, and tenure preferences. Some rent because homeownership is financially out of reach; others rent by choice because of flexibility, mobility, household size, or lifestyle considerations. They also occupy many different forms of housing, from single-family homes to duplexes to large multifamily buildings. According to the Robert Charles Lesser & Co. (2023) Renter Consumer Preference Survey, 51% of respondents said their ideal rental unit type was a single-family home, while another 21% preferred a townhouse or duplex, figures that challenge the assumption that renters as a class prefer high-density apartment living.
Lenders and Financial Institutions
Actors within the housing finance system originate mortgage credit, intermediate capital, and supply liquidity to housing markets. This category includes depository institutions such as banks and credit unions, nonbank mortgage lenders, and secondary-market institutions such as Fannie Mae and Freddie Mac. In the primary market, these institutions extend credit directly to borrowers and shape household purchasing power through interest rates, underwriting standards, and loan terms. In the secondary market, they purchase and securitize mortgages, replenish lender capital, and promote liquidity and standardization across the system. Lenders and financial institutions are not merely facilitators of housing exchange; they are central determinants of credit availability, effective demand, and the broader structure of housing-market outcomes.
Institutional investors and Real Estate Investment Trusts (REITs) are large-scale investment entities that acquire, own, operate, manage, or finance income-producing real estate. They include private equity firms, pension funds, asset managers, insurance companies, and real estate investment trusts. Unlike small landlords, institutional investors typically deploy pooled capital at scale and evaluate housing primarily as an income-generating and appreciating asset class. Their share of the U.S. single-family-rental stock remains modest, below roughly 1% on most measures, but their concentration in particular Sun Belt metros makes them politically visible (Pinto, 2026).
Insurers absorb or spread specific risks within housing finance, especially the risk of borrower default or property loss. In the mortgage context, this includes private mortgage insurers and public mortgage-insurance programs such as those administered through the Federal Housing Administration. Mortgage insurance reduces lender or investor exposure when borrowers make smaller down payments, expanding access to credit for some households. The Federal Housing Finance Agency’s Private Mortgage Insurer Eligibility Requirements framework regulates this segment of the conventional mortgage system. Property-casualty insurers, separately, underwrite the homeowners insurance escrowed in PITI, the cost driver discussed at length in the Indicators section.
Mortgage brokers are intermediaries who help borrowers locate, compare, and obtain mortgage loans, but who generally do not supply the loan funds themselves. The Consumer Financial Protection Bureau distinguishes a mortgage lender, who makes direct loans, from a broker, who arranges financing without bearing lending risk. Brokers reduce search costs, expand borrower access to loan options, and channel demand into the mortgage system.
Mortgage servicers are firms responsible for the ongoing administration of a mortgage after origination: collecting monthly principal and interest payments, managing escrow accounts for taxes and insurance, handling borrower communications, processing delinquencies, and overseeing loss mitigation or foreclosure when necessary. Fannie Mae’s Servicing Guide describes the operational rules and contractual obligations governing servicer activity, including escrow administration, borrower interaction, and default management. Servicers therefore occupy a critical position between borrower and investor: they do not usually originate the loan or own the mortgage-backed security, but they manage day-to-day performance and strongly influence borrower experience and default outcomes.
Government and Regulatory Bodies
Public institutions and quasi-public authorities shape the housing market through monetary policy, credit regulation, mortgage insurance, building standards, subsidy programs, and oversight of housing-finance institutions.
The Federal Housing Administration (FHA), which operates within HUD, does not generally lend directly to homebuyers. Instead, it insures approved mortgages against loss, thereby reducing lender risk and expanding credit access for borrowers who may not qualify as easily in the conventional market. FHA mortgage insurance protects lenders against losses if a property owner defaults, making lenders more willing to offer mortgage credit to lower down-payment and first-time borrowers.
The Federal Housing Finance Agency (FHFA) is the chief federal regulator of the government-sponsored housing-finance system, including Fannie Mae, Freddie Mac, and the Federal Home Loan Banks. FHFA ensures that these entities operate in a safe and sound manner and serve as a reliable source of liquidity, stability, and affordability for housing finance and community investment.
The Federal Reserve influences the housing market primarily through monetary policy. By setting policy and influencing short-term interest rates and broader financial conditions, the Fed affects mortgage borrowing costs, credit availability, construction financing, and overall housing demand. Although the Fed does not set mortgage rates directly, changes in the federal funds rate and broader interest-rate expectations strongly affect mortgage markets through capital-market transmission.
The International Code Council (ICC) is not a government agency. It is a private code-development organization whose model codes — most notably the International Building Code and International Residential Code — are widely adopted by state and local governments. The ICC develops the International Codes through a governmental consensus process, and its codes are utilized across all 50 states. Its role in the housing market is therefore indirect but important: it helps shape the regulatory framework that governs how housing can be designed, permitted, and constructed.
The U.S. Department of Housing and Urban Development (HUD) serves as the federal government’s principal housing agency. HUD administers rental assistance, public housing support, community-development programs, fair-housing enforcement, and major components of federal housing policy. It also oversees the Federal Housing Administration and large portions of the federal affordable-housing infrastructure. HUD influences both the demand side and the supply side of housing by subsidizing access, shaping affordability programs, and administering housing-related grants and insurance frameworks.
Common Property Types
Commercial properties are real estate used primarily for business, service, office, retail, industrial, lodging, or similar nonresidential purposes. Commercial uses are generally distinguished from residential uses by how the property is occupied and regulated.
Mixed-use properties are buildings or developments that combine two or more land uses, most commonly residential and commercial, within the same structure or site. A typical example is ground-floor retail with apartments or offices above.
Multifamily homes are residential properties containing more than one housing unit on a single lot or within a single structure or development. This includes duplexes, triplexes, fourplexes, townhome clusters, apartment buildings, and condominium buildings.
Public housing is rental housing owned or operated by a public housing authority for eligible low-income households. HUD describes public housing as housing established to provide decent and safe rental housing for eligible low-income families, the elderly, and persons with disabilities.
Single-family residential homes are detached dwellings designed for occupancy by one household. In common U.S. usage, this usually refers to one principal housing unit on its own lot, though local codes may permit related features such as garages or accessory units.
Unique Property Types
Accessory dwelling units (ADUs) are smaller, secondary housing units located on the same lot as a principal dwelling. An ADU may be attached to the main home, detached in a separate structure, or created within an existing house, such as a garage apartment or basement unit. ADUs are particularly relevant in Texas because they are useful for keeping extended family close—a common living arrangement—while also allowing independent living for relatives who choose to downsize as they age. They can also provide rental income for owners and an entry point to homeownership for renters.
Missing middle housing refers to a range of small-scale, low-rise, multiunit or clustered housing types that fall between detached single-family homes and large apartment buildings. The category includes duplexes, triplexes, fourplexes, townhomes, courtyard apartments, and bungalow courts—housing types compatible in scale with single-family homes. Missing middle housing has largely disappeared from new American construction over the past 60 years, a casualty of single-family-only zoning. Restoring it is one of the central aims of the 89th Legislature’s reform package.
Tiny homes are very small dwelling units, usually substantially smaller than a conventional house, designed for compact living. The term is informal more often than legal, so the exact size threshold varies by jurisdiction, builder, and code context.
Land-Use and Zoning
The land-use vocabulary is dense, and policymakers should be conversant in it. The terms below include items likely to be encountered in a typical Texas zoning case, from the broad regulatory categories down to the specific dimensional rules that determine whether a particular project is feasible.
Aesthetic requirements: Design-related regulations governing the visual appearance of buildings or sites, such as facade materials, rooflines, window proportions, screening, and architectural compatibility standards. Oftentimes, the imposition of these requirements invites added cost and less consumer choice.
Annexation: The process by which a municipality extends its boundaries to incorporate adjacent land. After 2017 reforms, most Texas annexations require consent of affected property owners, while the process of voluntary annexation was streamlined.
Building code: A set of technical construction and safety standards governing how buildings must be designed and built. Unlike zoning, which governs land use and development form, building codes govern structural, safety, and habitability requirements.
By-right development: Development that complies with existing zoning and development regulations and therefore may proceed administratively without discretionary approval.
City council: The local governing body that typically adopts and amends zoning ordinances, approves rezoning requests, and establishes broader land-use policy.
Comprehensive plan: A long-range policy document that sets out a community’s goals for growth, land use, transportation, infrastructure, housing, and development. In Texas, comprehensive plans are typically advisory.
Conditional use: A use allowed only after additional review and approval, usually because of its potential compatibility impacts on surrounding properties.
Density: The number of housing units allowed on a given amount of land, often expressed as units per acre.
Development standards: The rules governing how property may be developed, including setbacks, height, lot coverage, floor-area ratio, parking, landscaping, and frontage.
Discretionary approval: A development approval requiring individualized review and judgment by a public body or official, rather than automatic approval based solely on code compliance.
Downzoning: A zoning change that reduces development intensity, such as lowering allowable density, increasing minimum lot sizes, or restricting previously permitted uses.
Dwelling unit: A residential unit providing independent living facilities for one household, typically including permanent provisions for living, sleeping, cooking, and sanitation.
Entitlement: A legal approval or set of approvals allowing a proposed development to proceed, such as rezoning, plat approval, site plan approval, or a special use permit.
Euclidean zoning: The conventional zoning approach, named for Village of Euclid v. Ambler Realty Co. (1926), that separates land uses into distinct districts and regulates development within each district through uniform rules.
Floor-area ratio: The ratio of a building’s total floor area to the size of the lot on which it sits, used to regulate development intensity.
Form-based code: A land development regulation that emphasizes building form, site design, and the relationship of structures to streets and public space, often more than strict separation of land uses.
Frontage requirement: A rule requiring a lot to have a minimum amount of frontage on a public street or approved access way.
Greenfield development: New development on previously undeveloped land, often at the urban fringe.
Height limit: The maximum permitted height of a building or structure under zoning or development regulations.
Impact fee: A charge imposed on new development to help fund infrastructure or public facilities needed to serve growth, such as roads, water, sewer, or parks. Authorized in Texas under Local Government Code Chapter 395.
Infill development: New construction on vacant or underused land within an already developed area, typically where infrastructure and surrounding uses already exist.
Land-use: The way land is used or intended to be used — residential, commercial, industrial, agricultural, civic, or mixed-use.
Lot coverage: The portion or percentage of a lot that may be occupied by buildings or impervious surfaces.
Lot width: The minimum required horizontal dimension of a lot, usually measured at the building line or frontage.
Minimum lot size: The smallest lot area on which a particular use or dwelling may be built. Minimum lot size requirements directly affect land consumption, neighborhood density, and the cost of entry-level housing.
Nonconforming structure: A building or structure that was lawfully established under prior regulations but no longer complies with current zoning standards.
Nonconforming use: A land use that was lawful when established but is no longer permitted under current zoning. Nonconforming uses are often allowed to continue subject to restrictions on enlargement, rebuilding, or abandonment.
Overlay district: A mapped zoning layer placed over an existing base district to impose additional requirements, standards, incentives, or protections without replacing the underlying zoning.
Parking minimum: A requirement that a development provide at least a specified number of off-street parking spaces.
Parking maximum: A rule capping the number of parking spaces that may be provided, often used in denser or transit-served areas.
Permitted use: A land use allowed as of right within a zoning district, subject to compliance with applicable regulations.
Planned development: A specially regulated project or district that allows a coordinated development plan, often with customized standards, mixed uses, or negotiated departures from base zoning.
Plat: A map or legal document showing the subdivision of land into lots, blocks, streets, easements, and other features, typically submitted for local approval and recording.
Rezoning: A legislative change to the zoning classification of a parcel or area, such as changing land from single-family residential to multifamily or mixed-use.
Setback: The required minimum distance between a building or structure and a property line, street, or other defined boundary.
Site plan: A detailed drawing or set of plans showing the layout of a proposed development, including building placement, parking, access, landscaping, drainage, and other design elements.
Special use permit: Authorization to allow a use that is conditionally permitted within a zoning district, subject to case-specific review and conditions. Sometimes called a conditional use permit.
Subdivision regulation: Local rules governing how land may be divided into lots, blocks, streets, easements, and public dedications.
Upzoning: A zoning change that allows more intensive development than was previously permitted: higher density, greater height, smaller lots, or multifamily where only single-family was previously allowed.
Urban growth boundary: A policy or mapped line intended to limit outward urban expansion and direct development inward or toward designated growth areas.
Use restriction: A zoning rule limiting the types of activities or structures permitted on a property.
Variance: Permission to depart from a specific zoning requirement, usually dimensional, when strict enforcement would create practical difficulty or unnecessary hardship.
Zoning: A local regulatory system that divides a city or county into districts and prescribes what uses, densities, building forms, and development standards are permitted in each district.
Zoning board of adjustment: A quasi-judicial local body that hears requests for variances, appeals of zoning-administration decisions, and certain special exceptions or interpretations under the zoning ordinance.
Zoning commission: A local advisory or decision-making body that reviews proposed zoning changes, text amendments, and land-use matters and typically makes recommendations to the governing body.
Common Terms
Area median income (AMI): A measure of area income used to set eligibility thresholds for many housing programs. HUD calculates median family incomes for metropolitan areas and nonmetropolitan counties; income limits are then set at percentages of that area figure, such as 50% or 80% of AMI.
Gentrification: A process in which rising investment, incomes, and property values transform a neighborhood, often bringing physical improvement and new amenities while also increasing rents, home prices, taxes, and displacement pressures for existing lower-income residents.
Low-Income Housing Tax Credit (LIHTC): A federal tax credit used to encourage private investment in qualified low-income rental housing. Owners of qualified buildings may claim the credit over a 10-year credit period, while state housing agencies allocate credits to projects.
Not in my backyard (NIMBY): A label for opposition to nearby development, often housing, based on concerns about neighborhood character, traffic, parking, noise, school crowding, or property values.
Rent-burdened: A household that spends more than 30% of its income on housing costs. The Census Bureau, citing HUD’s standard, treats households spending more than 30% of income on housing as cost-burdened, and more than 50% as severely cost-burdened.
Rent control: A law or regulatory regime that limits how much landlords may charge for rent or how much rents may increase over time. Rent control is preempted under Texas law except in narrowly defined emergencies (Tex. Loc. Gov’t Code § 214.902).
Transit-oriented development: Compact, relatively dense, walkable development located near high-quality public transportation, typically designed to increase access to jobs, services, and housing while reducing car dependence.
Yes in my backyard (YIMBY): A label for support of additional housing and land-use reform, grounded in the view that more housing supply, especially in high-demand areas, improves affordability and expands choice.
References
Acolin, A., Lin, D., & Wachter, S. (2024). Why do young adults coreside with their parents? Real Estate Economics, 52(2), 432–456. https://onlinelibrary.wiley.com/doi/abs/10.1111/1540-6229.12467
Adams, C., Hamilton, E., & Gardner, C. (2024). Texas trends: Housing survey 2024. University of Houston, Hobby School of Public Affairs. https://uh.edu/hobby/txtrends/housing.pdf
Board of Governors of the Federal Reserve System. (n.d.-a). Monetary policy. Retrieved September 18, 2026, from https://www.federalreserve.gov/
Board of Governors of the Federal Reserve System. (n.d.-b). Market yield on U.S. Treasury securities at 10-year constant maturity. FRED, Federal Reserve Bank of St. Louis. Retrieved September 18, 2026, from https://fred.stlouisfed.org/series/DGS10
Bonura, J. (2024). Increasing housing supply in the urban core through mixed-use commercial and residential. Texas Public Policy Foundation. https://www.texaspolicy.com/wp-content/uploads/2024/12/2024-12-TPP-Housing-Affordability-Mixed-Use-Bonura_FINAL.pdf
Bonura, J. (2025). Bill analysis: SB 673. Texas Public Policy Foundation. https://www.texaspolicy.com/wp-content/uploads/22025/02/2025-02-Bill-Analysis-TPP-SB673-Bonura_FINAL.pdf
Bonura, J. (2026a). Just the facts: Property taxes in Texas. Texas Public Policy Foundation. https://www.texaspolicy.com/wp-content/uploads/2026/04/2026-04-TPP-Just-the-Facts-Debt-FY-2025-Bonura.pdf
Bonura, J. (2026b). Just the facts: Local government spending. Texas Public Policy Foundation. https://www.texaspolicy.com/just-the-facts-local-government-spending/
Britschgi, C. (2025, September 9). Steamed Texas NIMBYs mandate saunas to stop new housing. Reason. https://reason.com/2025/09/09/steamed-nimbys-mandated-saunas-to-stop-new-housing/
Bronin, S., & Markley, S. (2025). Minimum lot sizes. National Zoning Atlas. https://www.zoningatlas.org/lots
Büchler, S., & Lutz, B. (2024). Land-use regulation, the redistribution of wages, and welfare. Journal of Urban Economics, 142, 103689. https://doi.org/10.1016/j.jue.2024.103689
Butler, A. (2024). Gov. Abbott takes aim at investors hounding single-family market. The Dallas Morning News. https://www.dallasnews.com/business/real-estate/2024/03/15/gov-abbott-takes-aim-at-investors-hounding-single-family-market/
City of Arlington. (2025). Ordinance No. 25-059. https://www.arlingtontx.gov/files/assets/city/v/1/planning-and-development-services/documents/zoning-unified-development-code/ord.-25-059-august-26-2025.pdf
City of Frisco. (2025). Amendments to Frisco zoning ordinance, ZA25-0004. https://ecode360.com/FR6313/laws/LF2459017.pdf
City of Irving. (2025). City Council agenda packet, August 28, 2025. https://irvingtx.gov/corecode/storage/uber_resource/uploaded_pdfs/8-28-25regmtg-agenda-packet_1755893207.pdf
City of Killeen. (2025). Ordinance amending Chapter 31. https://killeen.legistar.com/LegislationDetail.aspx?GUID=7ACE1C3D-832C-4DEE-8322-3B78102AFEE2
The Conference Board. (2026). U.S. consumer confidence edged up again in April. The Conference Board Consumer Confidence Index. https://www.conference-board.org/topics/consumer-confidence
Crockett, B., Bonura, J., & Shepard, J. (2025). Come and build it: Housing policy reform in Texas. Texas Public Policy Foundation. https://www.texaspolicy.com/wp-content/uploads/2025/11/2025-11-TPP-Housing-Policy-Reform-BonuraCrockettShepard.pdf
Dettling, L. J., & Kearney, M. S. (2014). House prices and birth rates: The impact of the real estate market on the decision to have a baby. Journal of Public Economics, 110, 82–100. https://www.sciencedirect.com/science/article/abs/pii/S0047272713001904
Duca, J., & Murphy, A. (2021). Why housing prices surged as the COVID-19 pandemic took hold. Federal Reserve Bank of Dallas. https://www.dallasfed.org/research/economics/2021/1228
Emrath, P. (2021, May). Government regulation in the price of a new home: 2021 update. National Association of Home Builders. https://www.nahb.org/-/media/NAHB/news-and-economics/docs/housing-economics-plus/special-studies/2021/special-study-government-regulation-in-the-price-of-a-new-home-may-2021.pdf
Fannie Mae. (2026). Home Purchase Sentiment Index. National Housing Survey. https://www.fanniemae.com/research-and-insights/surveys-indices/national-housing-survey
Fechter, J. (2025, September 3). Texas suburbs resist new state law allowing more apartments. The Texas Tribune. https://www.texastribune.org/2025/09/03/texas-legislature-apartments-housing-suburbs/
Fechter, J. (2026, January 27). Census: Texas led U.S. states in population growth in 2025. The Texas Tribune. https://www.texastribune.org/2026/01/27/texas-population-2025-census/
Federal Housing Finance Agency. (n.d.). About FHFA. Retrieved September 18, 2026, from https://www.fhfa.gov/
Federal Reserve Bank of Atlanta. (2026). Home Ownership Affordability Monitor. https://www.atlantafed.org/research-and-data/data/home-ownership-affordability-monitor
Fiveable. (n.d.). Affordable housing policies. Retrieved September 18, 2026, from https://fiveable.me/key-terms/ap-gov/affordable-housing-policies
Foley & Lardner LLP. (2026). Client briefing: Texas Senate Bill 840 and Texas Senate Bill 2477 (89th Legislature, 2025 session). https://www.foley.com/p/102ltvo/client-briefing-texas-senate-bill-840-and-texas-senate-bill-2477-89th-legislatu/
Freddie Mac. (2026). Primary Mortgage Market Survey. https://www.freddiemac.com/pmms
Garcia, A. (2025). Sellers housing trends report 2024. Zillow Research. https://www.zillow.com/research/sellers-housing-trends-report-2024-34385/
Ge, S., Johnson, S., & Tzur-Ilan, N. (2026, March 24). Home insurance premiums influence mortgage delinquencies, relocations. Federal Reserve Bank of Dallas. https://www.dallasfed.org/research/economics/2026/0324
Glaeser, E. L., & Gyourko, J. (2018). The economic implications of housing supply. Journal of Economic Perspectives, 32(1), 3–30. https://www.aeaweb.org/articles?id=10.1257/jep.32.1.3
Gyourko, J., Hartley, J., & Krimmel, J. (2021). The local residential land use regulatory environment across U.S. housing markets: Evidence from a new Wharton index. Wharton Real Estate Center. https://realestate.wharton.upenn.edu/wp-content/uploads/2022/04/w835.pdf
Hamilton, E. (2024). The effects of minimum-lot-size reform on Houston land values. Cityscape, 26(3). https://www.huduser.gov/portal/periodicals/cityscape/vol26num3/ch9.pdf
HJR 1. Enrolled. 89th Texas Legislature. Regular. https://capitol.texas.gov/tlodocs/89R/billtext/pdf/HJ00001F.pdf
Horowitz, A., & Hatchett, C. (2025, July 10). New Texas laws put state on path to improved housing affordability. The Pew Charitable Trusts. https://www.pew.org/en/research-and-analysis/articles/2025/07/10/new-texas-laws-put-state-on-path-to-improved-housing-affordability
Issa, D. (2009/2010). The role of government affordable housing policy in creating the global financial crisis of 2008. U.S. House of Representatives. https://oversight.house.gov/wp-content/uploads/2012/02/20100512affordablehousingpolicyandthefinancialcrisis.pdf
Joint Center for Housing Studies. (2021). Findings and lessons from two national surveys of landlords. Harvard University. https://www.jchs.harvard.edu/blog/findings-and-lessons-two-national-surveys-landlords
Joint Center for Housing Studies. (2024). America’s rental housing 2024. Harvard University. https://www.jchs.harvard.edu/americas-rental-housing-2024
Jones, H. (2026). The starter home shortage is easing – but unevenly. Realtor.com. https://www.realtor.com/research/starter-home-market-june-2026
Leigh, R., & Orrenius, P. (2026, February 20). Texas job growth expected to pick up following flat 2025. Federal Reserve Bank of Dallas. https://www.dallasfed.org/research/swe/2026/swe2603-orrenius-texasupdate
Lynch, E. (2025, January 20). Cost of constructing a home — 2024. National Association of Home Builders. https://www.nahb.org/-/media/NAHB/news-and-economics/docs/housing-economics-plus/special-studies/2025/special-study-cost-of-constructing-a-home-2024-january-2025.pdf
Markley, S. (2024). National Zoning Atlas: Metro Austin zoning snapshot. https://snmarkley1.github.io/Projects/NZA/
Mei, M. (2022). The welfare implications of minimum-lot-size reform: Evidence from Houston [Job market paper, University of Pennsylvania]. http://mikemei.com/uploads/1/3/7/2/137207430/mei_mike_2022_jmp.pdf
Mense, A. (2025). Supply elasticity and the welfare costs of housing market distortions. Journal of Political Economy. https://doi.org/10.1086/733977
Mohtashami, L. (2024). No, Wall Street investors are not buying up a bunch of homes. HousingWire. https://www.housingwire.com/articles/no-wall-street-investors-havent-bought-44-of-homes-this-year/
National Association of Home Builders. (n.d.). Multifamily housing. Retrieved September 18, 2026, from https://www.nahb.org/other/consumer-resources/types-of-home-construction/multifamily
National Association of Home Builders. (2025a). 5 key supply-side headwinds hurt housing supply, NAHB tells Congress. https://www.nahb.org/news-and-economics/press-releases/2025/03/5-key-supply-side-headwinds-hurt-housing-supply-nahb-tells-congress
National Association of Home Builders. (2025b). Households priced out by higher house prices and interest rates. https://www.nahb.org/news-and-economics/housing-economics/housings-economic-impact/households-priced-out-by-higher-house-prices-and-interest-rates
National Association of Home Builders. (2025c). Building permits by state and metro area. https://www.nahb.org/news-and-economics/housing-economics/state-and-local-data/building-permits-by-state-and-metro-area
National Association of Home Builders & National Multifamily Housing Council. (2022). Cost of regulations imposed by all levels of government on multifamily development. https://www.nmhc.org/globalassets/research–insight/research-reports/cost-of-regulations/2022-nahb-nmhc-cost-of-regulations-report.pdf
National Association of REALTORS. (n.d.). Single-family homes. Retrieved September 18, 2026, from https://www.nar.realtor/residential-real-estate/single-family-homes
National Association of REALTORS. (2025, November 4). First-time home buyer share falls to historic low of 21%, median age rises to 40. https://www.nar.realtor/newsroom/first-time-home-buyer-share-falls-to-historic-low-of-21-median-age-rises-to-40
National Zoning Atlas. (n.d.). Texas. Retrieved September 18, 2026, from https://www.zoningatlas.org/texas
Nemit, J. (2026). Telling renters the truth about property taxes. Texas Public Policy Foundation. https://www.texaspolicy.com/telling-renters-the-truth-about-property-taxes/
Orendain, A. (2025, March 21). New report highlights a severe shortage of affordable and available housing. Texas State Affordable Housing Corporation. https://www.tsahc.org/blog/new-report-highlights-a-severe-shortage-of-affordable-and-available-housing/
Pang, T., Theodos, B., & Choi, J. H. (2025). How do one-size-fits-all landlord-tenant laws affect small landlords? Urban Institute. https://www.urban.org/urban-wire/how-do-one-size-fits-all-landlord-tenant-laws-affect-small-landlords
Pinto, E. J. (2026). AEI Housing Center. American Enterprise Institute. https://www.aei.org/centers/housing-center/
Pinto, E. J., Peter, T., & Gailes, A. (2025). Strong foundations: A playbook for housing and economic growth. AEI Housing Center. https://aeihousingcenter.org/playbook/texas/
Quintero, J. (2018). Austin policies are making the affordability crisis worse. Texas Public Policy Foundation. https://www.texaspolicy.com/austin-policies-are-making-affordability-crisis-worse/
Quintero, J. (2021). Austin’s land grab adding to affordability woes. Texas Public Policy Foundation. https://www.texaspolicy.com/austins-land-grab-adding-to-affordability-woes/
Quintero, J. (2024). The ups and never downs of property taxes. Texas Public Policy Foundation. https://www.texaspolicy.com/the-ups-and-never-downs-of-property-taxes/
Quintero, J. (2026). Texas gave cities a tool for more housing affordability. Some are throwing it away. Texas Public Policy Foundation. https://www.texaspolicy.com/texas-gave-cities-a-tool-for-more-housing-affordability-some-are-throwing-it-away/
Quintero, J., & Meyers, I. (2025). College kids rejoice – housing reform is on the way! Texas Public Policy Foundation. https://www.texaspolicy.com/college-kids-rejoice-housing-reform-is-on-the-way/
Realtor.com. (n.d.). Housing inventory: Median days on market in Texas. FRED, Federal Reserve Bank of St. Louis. Retrieved September 18, 2026, from https://fred.stlouisfed.org/series/MEDDAYONMARTX
Redfin. (2026). Texas housing market. https://www.redfin.com/state/Texas/housing-market
SB 2. Enrolled. 88th Texas Legislature. Second Called Special Session. (2023). https://capitol.texas.gov/tlodocs/882/billtext/pdf/SB00002F.pdf
SB 673. House Committee Report. 89th Texas Legislature. Regular. (2025). https://capitol.texas.gov/tlodocs/89R/billtext/pdf/SB00673H.pdf
SB 840. Enrolled. 89th Texas Legislature. Regular. (2025). https://capitol.texas.gov/tlodocs/89R/billtext/pdf/SB00840F.pdf
SB 1567. Enrolled. 89th Texas Legislature. Regular. (2025). https://capitol.texas.gov/tlodocs/89R/billtext/pdf/SB01567F.pdf
S&P Dow Jones Indices. (2026). S&P CoreLogic Case-Shiller home price indices. https://www.spglobal.com/spdji/en/index-family/indicators/sp-corelogic-case-shiller/
Sands, A., & Sands, B. (2025). Affordable housing vs. housing affordability. Libertas Institute. https://libertas.institute/housing-crisis/affordable-housing-vs-housing-affordability/
Schill, M. H. (2005). Regulations and housing development: What we know. Cityscape: A Journal of Policy Development and Research, 8(1), 5–19. https://www.huduser.gov/periodicals/cityscpe/vol8num1/ch1.pdf
SFR Analytics. (2024). The top 10 largest homebuyers in 2023. https://newsletter.sfranalytics.com/p/the-top-10-largest-homebuyers-in
Strong Towns. (2016, February 23). Most affordable housing is not subsidized. https://www.strongtowns.org/journal/2016/2/23/most-affordable-housing-is-not-subsidized
Strong Towns. (2018, March 30). 17 head-scratcher housing words defined. https://archive.strongtowns.org/journal/2018/3/30/17-head-scratcher-housing-words-defined
TCW. (2025, December 18). Resetting the baseline: Housing costs and the new American economic reality. The Long View. https://www.tcw.com/Insights/2025/2025-12-18-The-Long-View
Tex. Loc. Gov’t Code § 212.009. https://statutes.capitol.texas.gov/Docs/LG/htm/LG.212.htm
Texas 2036. (2024). The Texas housing affordability crisis. https://texas2036.org/posts/the-texas-housing-affordability-crisis/
Texas A&M Real Estate Research Center. (n.d.-a). Commercial real estate. Texas A&M University. Retrieved September 18, 2026, from https://trerc.tamu.edu/commercial/
Texas A&M Real Estate Research Center. (n.d.-b). Housing activity. Texas A&M University. Retrieved September 18, 2026, from https://trerc.tamu.edu/data/housing-activity/?data-State=Texas
Texas A&M Real Estate Research Center. (n.d.-c). Housing affordability. Texas A&M University. Retrieved September 18, 2026, from https://trerc.tamu.edu/data/housing-affordability/?data-State=Texas
Texas A&M Real Estate Research Center. (2026a). Texas Housing Insight, March 2026. https://trerc.tamu.edu/reports/texas-housing-insight-march-2026/
Texas Comptroller of Public Accounts. (n.d.). Housing affordability challenge. Retrieved September 18, 2026, from https://comptroller.texas.gov/economy/in-depth/special-reports/housing-affordability/96-1999.pdf
Texas Comptroller of Public Accounts. (2024). Affordable housing in Texas. https://comptroller.texas.gov/economy/fiscal-notes/economics/2024/aff-housing/
Texas Policy Research. (2024). Texas property tax levies 1998–2024. https://www.texaspolicyresearch.com/texas-property-tax-levies-1998-2024/
Texas Demographic Center. (2025). Texas population projections. https://demographics.texas.gov/Estimates/
Texas Public Policy Foundation. (2021). Special session: Property rights and the local government permitting process. https://www.texaspolicy.com/special-session-property-rights-and-the-local-government-permitting-process/
Texas Public Policy Foundation. (2025a). The cost to build. https://www.texaspolicy.com/the-cost-to-build/
Texas Public Policy Foundation. (2025b). Austin’s simple fix for soaring housing costs. https://www.texaspolicy.com/austins-simple-fix-for-soaring-housing-costs/
Texas REALTORS, & Gibbs, A. (2025). 2025 Texas homebuyers and sellers report. https://www.texasrealestate.com/wp-content/uploads/2025_Texas_HomeBuyers_and_Sellers_Report.pdf
Texas State Affordable Housing Corporation. (2019). Housing affordability in Texas. https://www.tsahc.org/blog/post/housing-affordability-in-texas
Texas Workforce Commission. (2026). Texas labor market information. https://www.twc.texas.gov/programs/labor-market-information
U.S. Census Bureau. (n.d.). New private housing units authorized by building permits for Texas. FRED, Federal Reserve Bank of St. Louis. Retrieved September 18, 2026, from https://fred.stlouisfed.org/series/TXBPPRIV
U.S. Census Bureau. (2022). American Community Survey 5-year estimates, table S2503: Financial characteristics, Texas. https://data.census.gov/table/ACSST5Y2022.S2503?g=040XX00US48
U.S. Census Bureau. (2024-a). Financial characteristics [Data set]. American Community Survey, ACS 1-Year Estimates Subject Tables, Table S2503. https://data.census.gov/table/ACSST1Y2022.S2503
U.S. Census Bureau. (2024-b, September 12). Nearly half of renter households are cost-burdened, proportions differ by race [Press release]. https://www.census.gov/newsroom/press-releases/2024/renter-households-cost-burdened-race.html
U.S. Census Bureau. (2025). 2024 Annual Building Permits Survey: Highlights. https://www.census.gov/construction/bps/pdf/2024annualhighlights.pdf
U.S. Census Bureau. (2026). Resident population in Texas. FRED, Federal Reserve Bank of St. Louis. https://fred.stlouisfed.org/series/TXPOP
University of Michigan. (2026). Surveys of consumers: Index of Consumer Sentiment. http://www.sca.isr.umich.edu/
Worley, M., & de la Campa, E. (2025, January 6). Housing affordability didn’t worsen in 2024—The first time in four years that has happened. Redfin. https://www.redfin.com/news/housing-affordability-2024/
van Wijk, D. C., & Feijten, P. M. (2025). Housing affordability and family formation. https://pmc.ncbi.nlm.nih.gov/articles/PMC12618740/
Village of Euclid v. Ambler Realty Co., 272 U.S. 365 (1926). https://supreme.justia.com/cases/federal/us/272/365/
Wegmann, J., Baqai, A. N., & Conrad, J. (2023). Here come the tall skinny houses: Assessing single-family to townhouse redevelopment in Houston, 2007–2020. Cityscape, 25(2). https://www.huduser.gov/portal/periodicals/cityscape/vol25num2/ch8.pdf
Yousuf, M. (2026). Texas homeowners pay high insurance costs, face rising premiums. Federal Reserve Bank of Dallas. https://www.dallasfed.org/research/swe/2026/swe2609
Yushkov, A. (2026). Property taxes by state and county, 2026. Tax Foundation. https://taxfoundation.org/data/all/state/property-taxes-by-state-county/