Despite billions in property tax relief provided by recent state legislatures, Texans’ property tax bills continue to increase due to unrestricted spending at the local level.
Key points:
- City and county government spending continues to outstrip increases in both population and inflation.
- While the state government has constitutional and statutory spending limits, local governments do not.
- Elevated spending growth invites larger tax bills, bigger government, and mission creep.
The Texas Legislature should use its authority to apply spending limits to local government similar to those to which the state is subject.
Issue
Local governments across Texas have been spending outside the bounds of what is considered reasonable, placing an increasingly unaffordable burden on taxpayers as a result. Reasonable spending may be defined by how close changes in expenditure growth are to increases in population and inflation. The difference between adopted budgets and actual changes in population serves as an indication that there is at least some measure of mismanagement. For example, the City of Austin spent over $1.1 million redesigning the city logo (Sanders & Collier, 2025)—the same year the city council threatened to cut emergency services after the failure of Proposition Q, which would have raised the city’s property tax rate by more than 20% (Sanders & Tong, 2025). The City of Dallas has even asked its taxpayers to support its record $5.2 billion budget, “that fails to provide much-needed tax relief for Dallas residents,” according to remarks from a council member to CBS News (Armas, 2025). Unfortunately, there are no mechanisms outside of elections to prevent excesses in local government spending.
The state of Texas has four constitutionally mandated spending limits and one enshrined in statute. Those include a balanced budget or pay-as-you-go limit (Texas Const. Art. III, sec 49a); a restraint on the rate of growth of appropriations not dedicated by the Constitution pegged to the estimated rate of growth of the state’s economy (Texas Const. Art. VIII, sec 22a); a debt limit tied to 5% of the three-year average of unrestricted general revenue (Texas Const. Art. III, sec 49-j); a limit on welfare grants (Texas Const. Art. III, sec 51-a); and a constraint on general revenue-related growth limited to population and inflation (Texas Government Code, Sec. 316.001), though an inflation measure is not specifically proscribed using the Consumer Price Index in this research reflects a large survey of goods and services and can be generally applied across the state. If the state is subject to these limits, there should be no reason why local taxing entities should not operate within them as well.
The purpose of this research is to examine the adopted budgets of the ten most populous cities and counties in Texas to demonstrate the need for legislative intervention to rein in local spending.
City Spending
From 2015 to 2025, spending by city governments generally increased at a rate faster than population growth and inflation (P&I). Of the ten cities observed, eight had spending that outpaced their P&I. The City of Dallas had the largest gap between the P&I measurement and actual budget growth, with a 37% difference, while Lubbock had the slowest growth in spending, as its spending grew 16% slower than its P&I (as seen in Table 1).
Table 1
Tracking Trends: Most Populous Cities
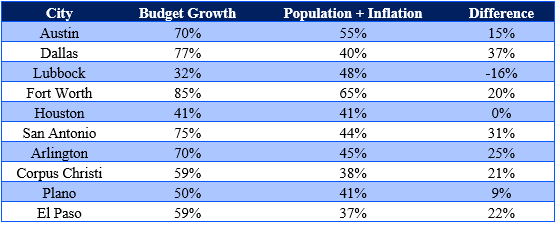
Note. Data from City and Town intercensal Population Totals:2010-2020, by U.S. Census Bureau, n.d.-a (https://www.census.gov/data/tables/time-series/demo/popest/intercensal-2010-2020-cities.html); Vintage 2024 Population Estimates, by Texas Demographic Center, n.d. (https://demographics.texas.gov/Estimates/ ); Consumer Price Index (CPI) Databases, by U.S. Bureau of Labor Statistics, n.d. (https://www.bls.gov/cpi/data.htm); as well as the author’s calculations
Austin
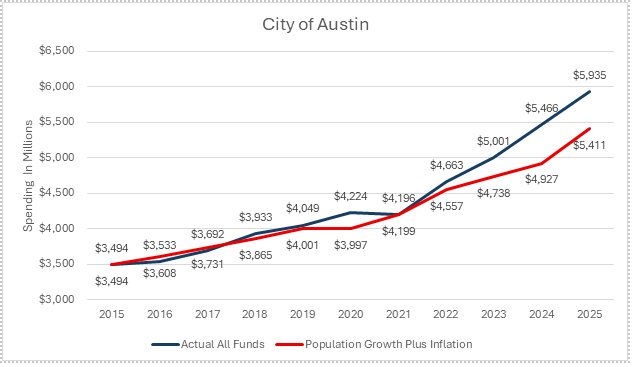
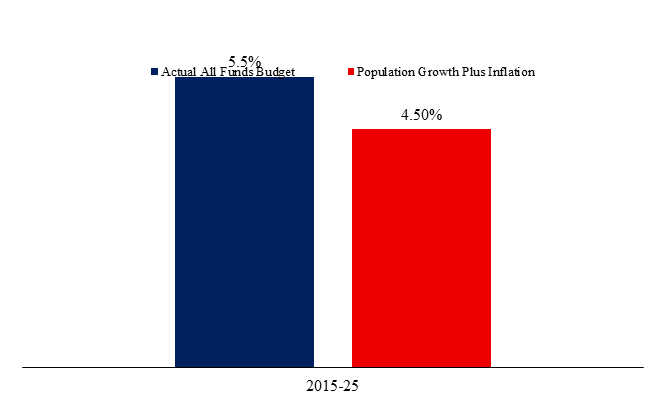
Spending: From 2015 to 2025, the City of Austin’s adopted budget increased from $3.5 billion to $5.9 billion, representing an average annual growth rate of 5.5% (City of Austin, n.d.).
Population: From 2015 to 2025, the city’s population grew from 921,114 to 1,054,007, equating to an average 1.4 % year-over-year increase (U.S. Census Bureau, n.d.-a; Texas Demographic Center, n.d.)1.
Inflation: From 2015 to 2025, inflation, as measured by the Consumer Price Index2 (U.S. city average, All items), rose from 237 to 321.94, averaging 3.13% year-over-year (U.S. Bureau of Labor Statistics, n.d.).
Population & Inflation: From 2015 to 2025, P&I increased by a combined 4.5%.
Hence, the City of Austin’s spending rose more rapidly than P&I from 2015 to 2025.
Dallas
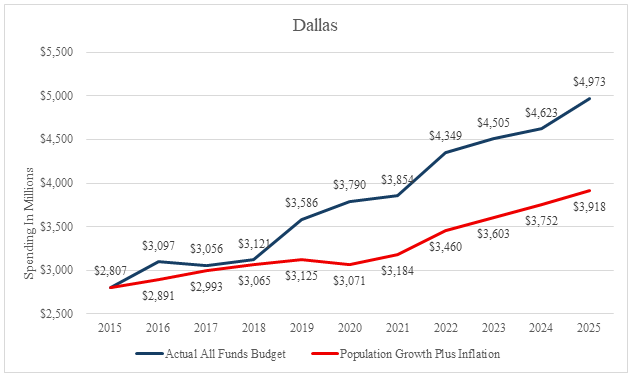
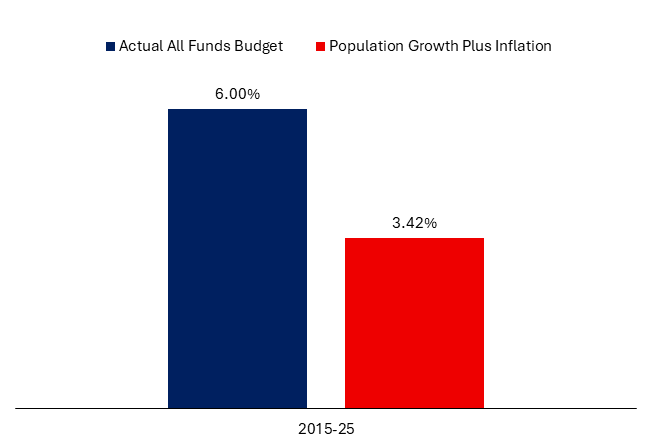
Spending: From 2015 to 2025, the City of Dallas’s adopted budget increased from $2.8 billion to $4.9 billion, representing an average annual growth rate of 6% (City of Dallas, n.d.).
Population: From 2015 to 2025, the city’s population grew from 1,301,329 to 1,338,750, for an average annual year-over-year increase of 0.29%.
Inflation: From 2015 to 2025, inflation rose from 237 to 321.94, for an average annual increase of 3.13%.
Population & Inflation: From 2015 to 2025, P&I increased by 3.42% combined.
Hence, the City of Dallas’s spending rose more rapidly than P&I from 2015 to 2025.
Lubbock
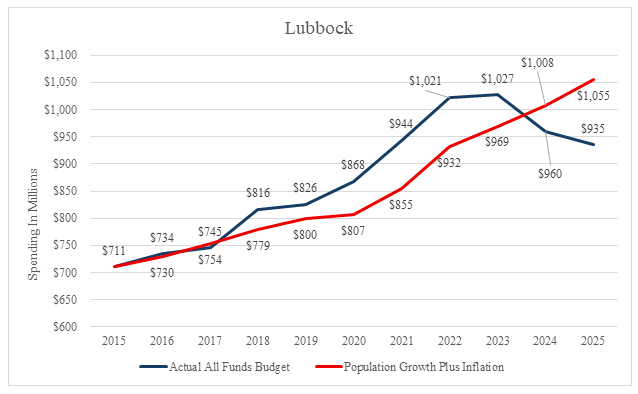
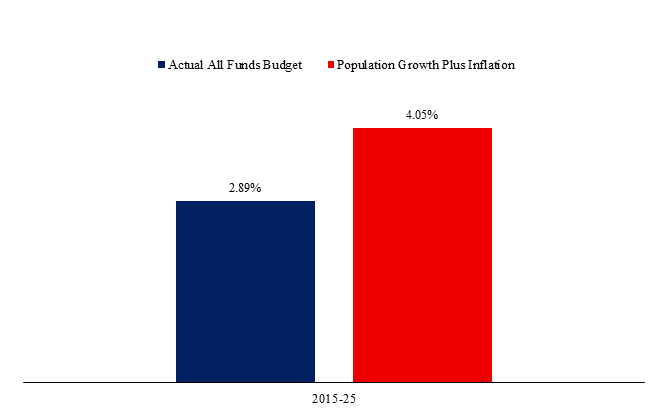
Spending: From 2015 to 2025, the City of Lubbock’s adopted budget increased from $710 million to $932 million, representing an average annual growth rate of 2.89% year-over-year (City of Lubbock, n.d.).
Population: From 2015 to 2025, the city’s population grew from 247,950 to 271,895, for an average annual year-over-year increase of 0.92%.
Inflation: From 2015 to 2025, inflation rose from 237 to 321.94, for an average annual increase of 3.13%.
Population & Inflation: From 2015 to 2025, P&I increased by 4.05% combined.
Hence, the City of Lubbock’s spending rose more slowly than P&I from 2015 to 2025.
Fort Worth
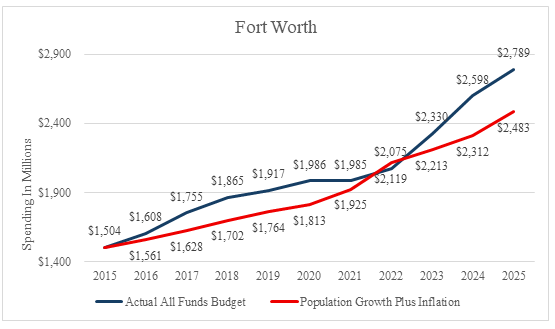
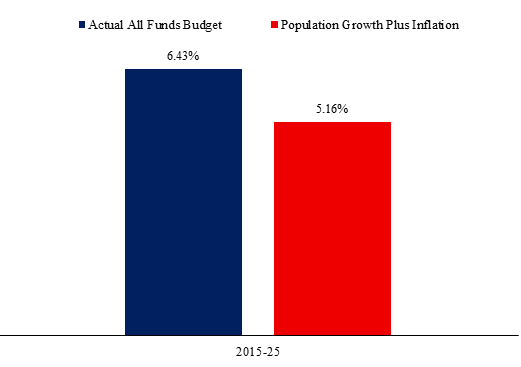
Spending: From 2015 to 2025, the City of Fort Worth’s adopted budget increased from $1.5 billion to $2.8 billion, representing an average annual growth rate of 6.43% year-over-year (City of Fort Worth, 2013; City of Fort Worth, 2014; City of Fort Worth, 2015; City of Fort Worth, 2016; City of Fort Worth, 2017; City of Fort Worth, n.d.).
Population: From 2015 to 2025, the city’s population grew from 835,356 to 1,020,987, for an average annual year-over-year increase of 2.03%.
Inflation: From 2015 to 2025, inflation rose from 237 to 321.94, averaging a 3.13% year-over-year increase.
Population & Inflation: From 2015 to 2025, P&I increased by 5.16% combined.
Hence, the City of Fort Worth’s spending rose more rapidly than P&I from 2015 to 2025.
Houston
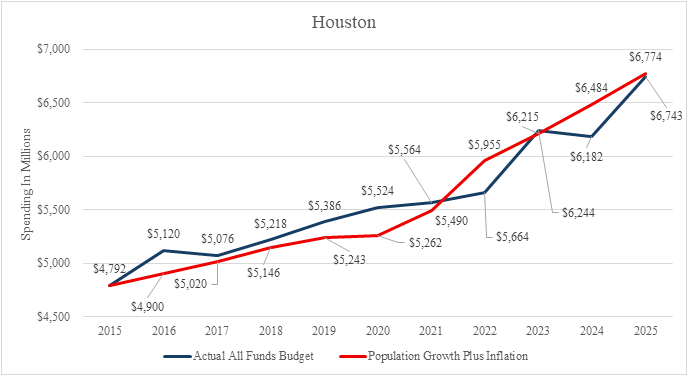
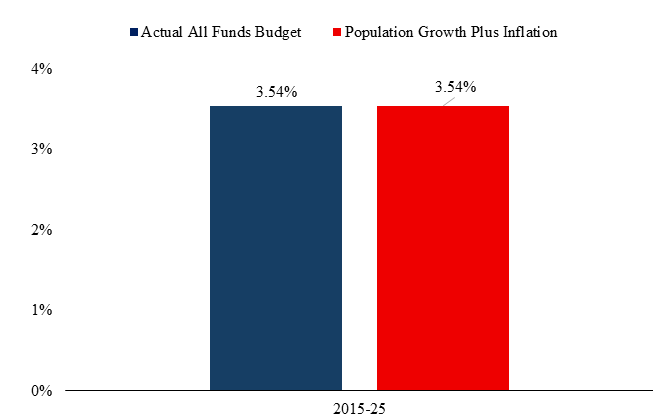
Spending: From 2015 to 2025, the City of Houston’s adopted budget increased from $4.8 billion to $6.7 billion, representing an average annual growth rate of 3.54% (City of Houston, n.d.).
Population: From 2015 to 2025, the city’s population grew from 2,286,908 to 2,383,293, for an average annual year-over-year increase of 0.42%.
Inflation: From 2015 to 2025, inflation rose from 237 to 321.94, averaging a 3.13% year-over-year increase.
Population & Inflation: From 2015 to 2025, P&I increased by 3.54% combined.
Hence, the City of Houston’s spending rose at the same rate as P&I from 2015 to 2025.
San Antonio
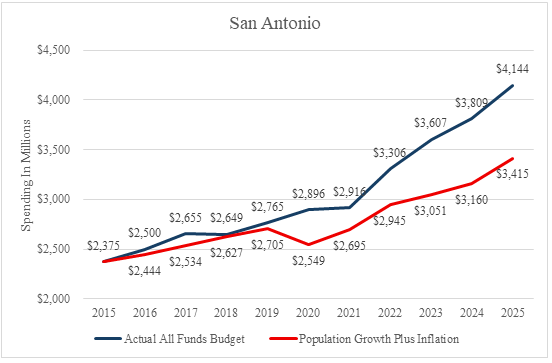
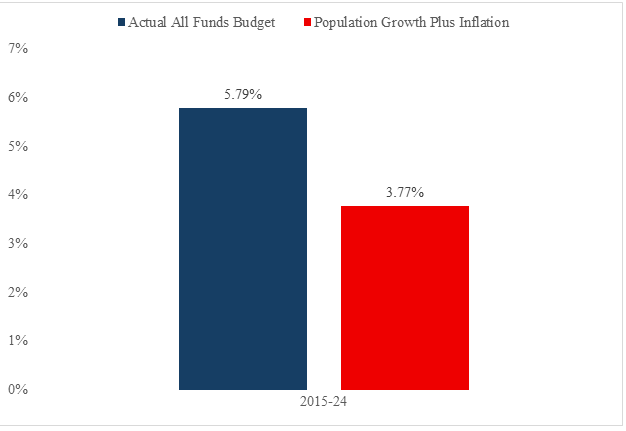
Spending: From 2015 to 2025, the City of San Antonio’s adopted budget increased from $2.4 billion to $4.1 billion, representing an average annual growth rate of 5.79% (City of San Antonio, n.d.).
Population: From 2015 to 2025, the city’s population grew from 1,464,043 to 1,554,626, for an average annual year-over-year increase of 0.64%.
Inflation: From 2015 to 2025, inflation rose from 237 to 321.94, averaging a 3.13% year-over-year increase.
Population & Inflation: From 2015 to 2025, P&I increased by 3.77% combined.
Hence, the City of San Antonio’s spending rose more slowly than P&I from 2015 to 2025.
Arlington
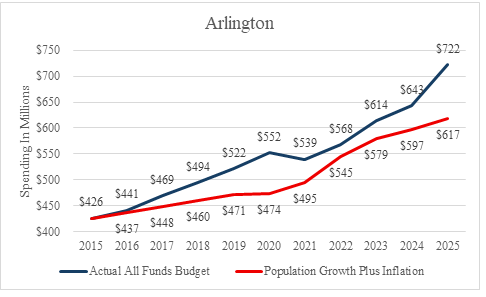
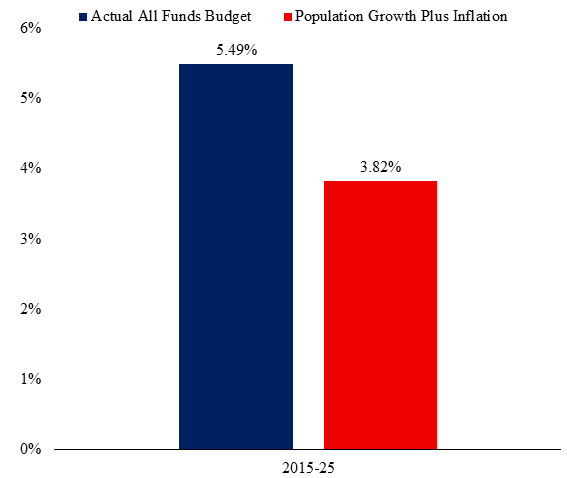
Spending: From 2015 to 2025, the City of Arlington’s adopted budget increased from $426 million to $722 million, representing an average annual growth rate of 5.49% (City of Arlington, n.d.).
Population: From 2015 to 2025, the city’s population grew from 386,208 to 413,519, for an average annual year-over-year increase of 0.69%.
Inflation: From 2015 to 2025, inflation rose from 237 to 321.94, averaging a 3.13% year-over-year increase.
Population & Inflation: From 2015 to 2025, P&I increased by 3.82% combined.
Hence, the City of Arlington’s spending rose more rapidly than P&I from 2015 to 2025.
Corpus Christi
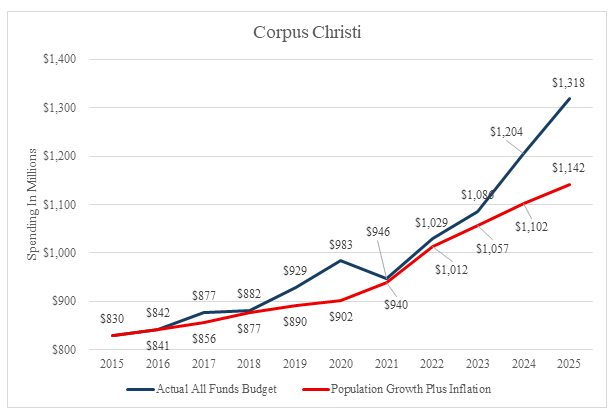
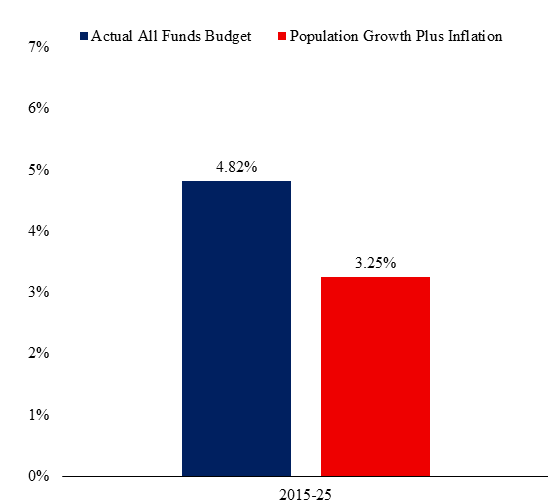
Spending: From 2015 to 2025, the City of Corpus Christi’s adopted budget increased from $830.4 million to $1.3 billion, representing an average annual growth rate of 4.82% year-over-year (City of Corpus Christi, n.d.).
Population: From 2015 to 2025, the city’s population grew from 319,757 to 323,718, for an average annual year-over-year increase of 0.12%.
Inflation: From 2015 to 2025, inflation rose from 237 to 321.94, averaging a 3.13% year-over-year increase.
Population & Inflation: From 2015 to 2025, P&I increased by 3.25% combined.
Hence, the City of Corpus Christi’s spending rose more rapidly than P&I from 2015 to 2025.
Plano
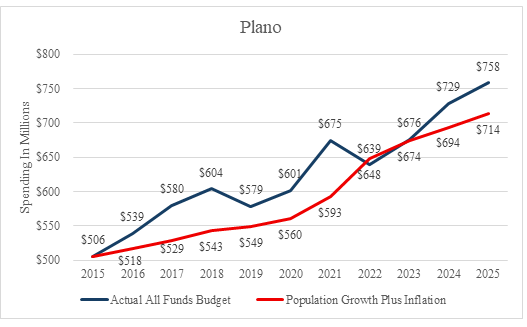
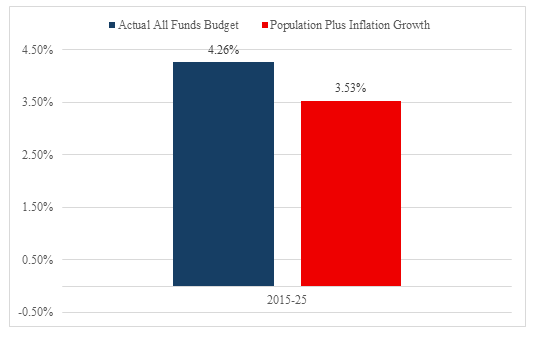
Spending: From 2015 to 2025, the City of Plano’s adopted budget increased from $506 million to $758 million, representing an average annual growth rate of 4.26% year-over-year3 (City of Plano, n.d.).
Population: From 2015 to 2025, the city’s population grew from 281,307 to 297,788, for an average annual year-over-year increase of 0.4%.
Inflation: From 2015 to 2025, inflation rose from 237 to 321.94, averaging a 3.13% year-over-year increase.
Population & Inflation: From 2015 to 2025, P&I increased by 3.53% combined.
Hence, the City of Plano’s spending rose more rapidly than P&I from 2015 to 2025.
El Paso
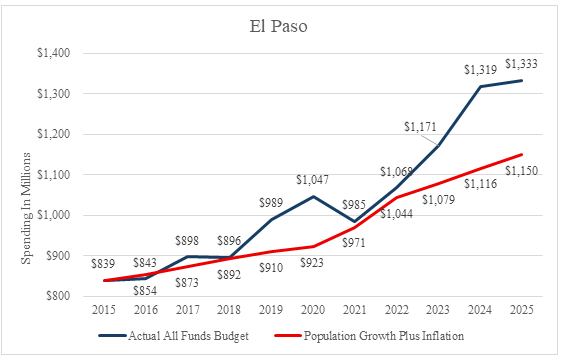
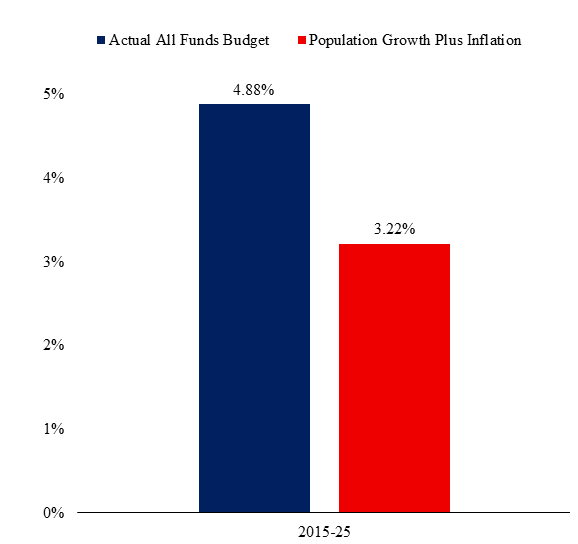
Spending: From 2015 to 2025, the City of El Paso’s adopted budget increased from $839 million to $1.3 billion, representing an average annual growth rate of 4.26% year-over-year4 (City of El Paso, n.d.).
Population: From 2015 to 2025, the city’s population grew from 674,061 to 680,148, for an average annual year-over-year increase of 0.09%.
Inflation: From 2015 to 2025, inflation climbed from 237 to 321.94, amounting to an average annual increase of 3.13%.
Population & Inflation: From 2015 to 2025, P&I increased by 3.22% combined.
Hence, the City of El Paso’s spending rose more rapidly than P&I from 2015 to 2025.
Counties
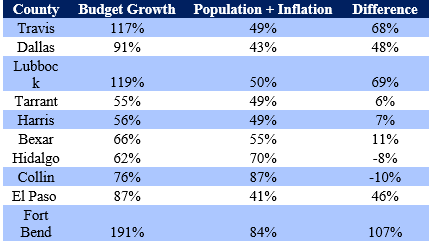
County spending, like city spending, generally increased more rapidly than increases in population and inflation from 2015 to 2025. Of the 10 counties observed, eight of them had spending that outpaced P&I. The most rapid growth came from Fort Bend County, with budgets growing more than 191% over the last decade. Collin County had the slowest spending growth when compared to the change in its P&I, as its budget grew 76%, but P&I grew by more than 87% (as seen in Table 2).
Table 2
Tracking Trends: Most Populous Counties
Note. Data from County Population Totals and Components of Change: 2020-2025, by U.S. Census Bureau, n.d.-a (https://www.census.gov/data/tables/time-series/demo/popest/2020s-counties-total.html); Vintage 2024 Population Estimates, by Texas Demographic Center, n.d. (https://demographics.texas.gov/Estimates/); Consumer Price Index (CPI) Databases, by U.S. Bureau of Labor Statistics, n.d. (https://www.bls.gov/cpi/data.htm); as well as the author’s calculations.
Travis County
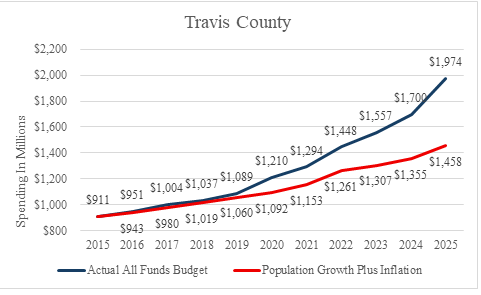
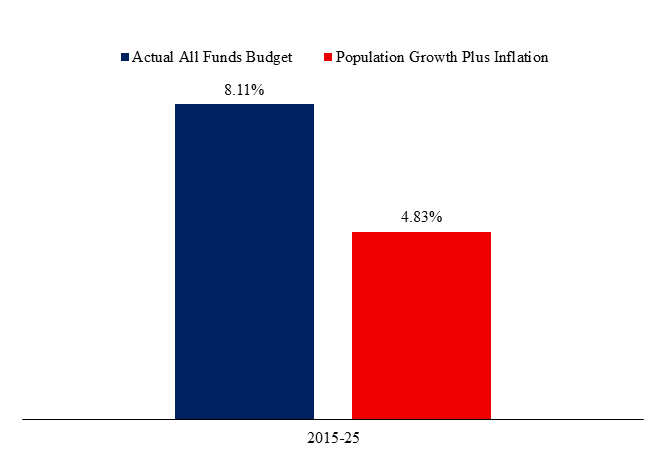
Spending: From 2015 to 2025, Travis County’s adopted budget increased from $911 million to $1.97 billion, representing an average annual growth rate of 8.11% year-over-year (Travis County, n.d.).
Population: From 2015 to 2025, the county’s population grew from 1,179,805 to 1,395,906, for an average annual year-over-year increase of 1.7%. (U.S. Census Bureau, n.d.-b).5
Inflation: From 2015 to 2025, inflation rose from 237 to 321.94, for an average annual increase of 3.13%.
Population & Inflation: From 2015 to 2025, P&I increased by 4.83% combined.
Hence, spending by Travis County rose more rapidly than P&I from 2015 to 2025.
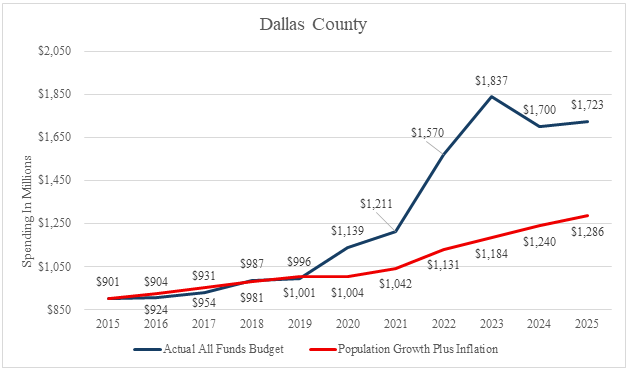
Dallas County
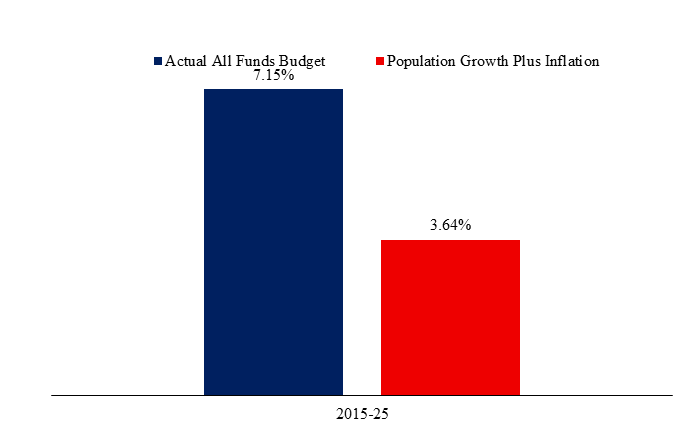
Spending: From 2015 to 2025, Dallas County’s adopted budget increased from $901 million to $1.7 billion, representing an average annual growth rate of 7.15% year-over-year (Dallas County, n.d.).
Population: From 2015 to 2025, the county’s population grew from 2,557,830 to 2,691,548, for an average annual year-over-year increase of 0.51%.
Inflation: From 2015 to 2025, inflation rose from 237 to 321.94, for an average annual increase of 3.13%.
Population & Inflation: From 2015 to 2025, P&I increased by 3.64% combined.
Hence, spending by Dallas County rose more rapidly than P&I from 2015 to 2025.
Lubbock County
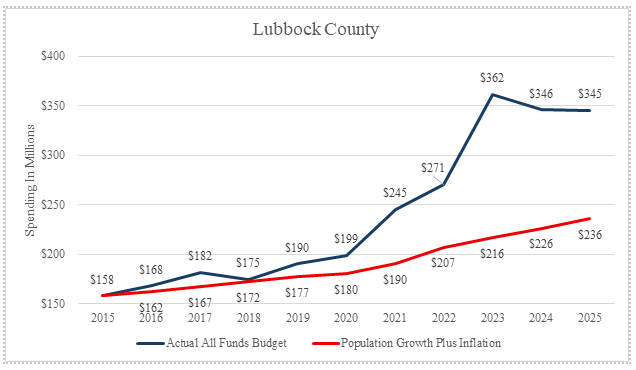
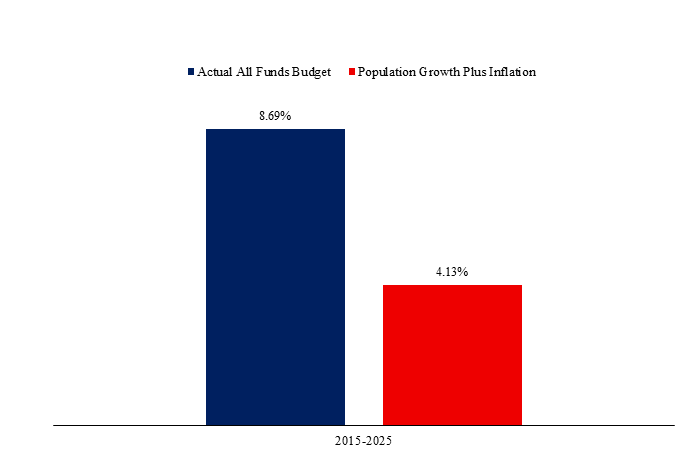
Spending: From 2015 to 2025, Lubbock County’s adopted budget increased from $158 million to $345 million, representing an average annual growth rate of 8.69% year-over-year (Lubbock County, 2013; Lubbock County, 2014; Lubbock County, n.d.).
Population: From 2015 to 2025, the county’s population grew from 298,337 to 329,582, for an average annual year-over-year increase of 1%.
Inflation: From 2015 to 2025, inflation rose from 237 to 321.94, for an average annual increase of 3.13%.
Population & Inflation: From 2015 to 2025, P&I increased by 4.13% combined.
Hence, spending by Lubbock County rose more rapidly than P&I from 2015 to 2025.
Tarrant County
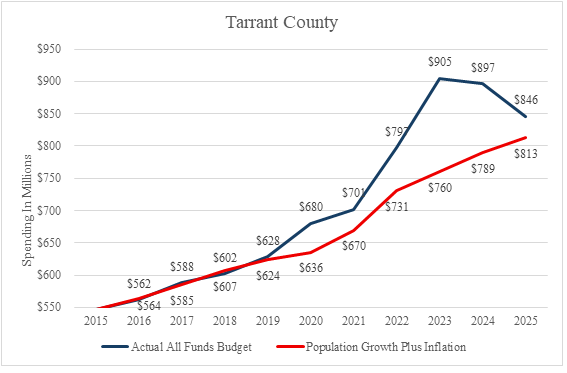
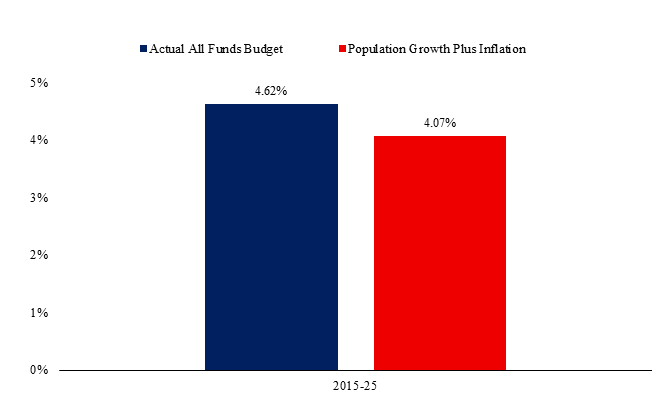
Spending: From 2015 to 2025, Tarrant County’s adopted budget increased from $547 million to $846 million, representing an average annual growth rate of 4.62% year-over-year (Tarrant County, n.d.).
Population: From 2015 to 2025, the county’s population grew from 1,984,880 to 2,245,229, for an average annual year-over-year increase of 0.94%.
Inflation: From 2015 to 2025, inflation rose from 237 to 321.94, for an average annual increase of 3.13%.
Population & Inflation: From 2015 to 2025, P&I increased by 4.07% combined.
Hence, spending by Tarrant County rose more rapidly than P&I from 2015 to 2025.
Harris County
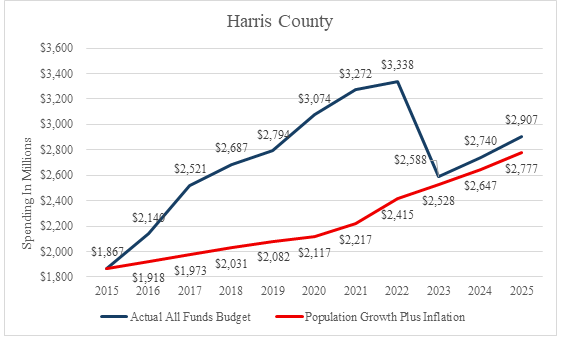
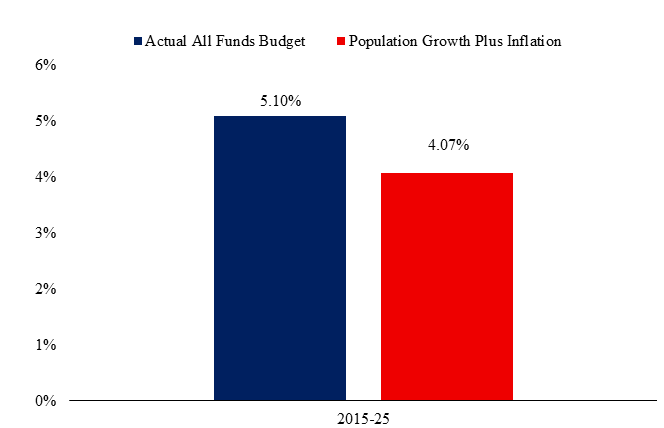
Spending: From 2015 to 2025, Harris County’s adopted budget increased from $1.9 billion to $2.9 billion, representing an average annual growth rate of 5.1% year-over-year (Harris County, n.d.).
Population: From 2015 to 2025, the county’s population grew from 4,557,846 to 5,003,892, for an average annual year-over-year increase of 0.94%.
Inflation: From 2015 to 2025, inflation rose from 237 to 321.94, averaging a 3.13% year-over-year increase.
Population & Inflation: From 2015 to 2025, P&I increased by 4.07% combined.
Hence, Harris County spending rose more rapidly than P&I from 2015 to 2025.
Bexar County
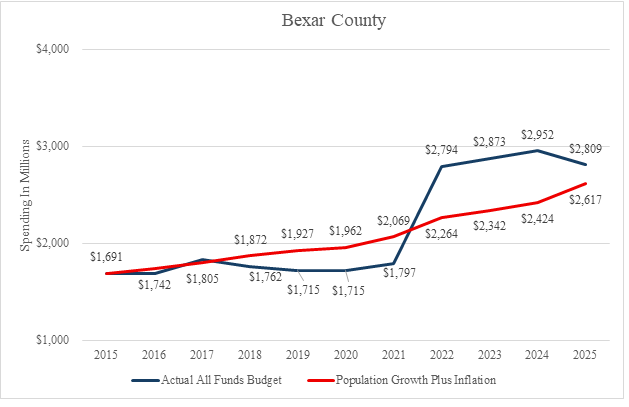
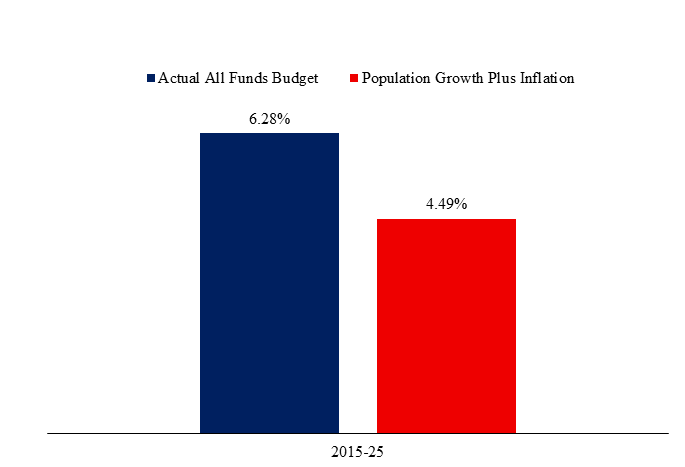
Spending: From 2015 to 2025, Bexar County’s adopted budget increased from $1.7 billion to $2.8 billion, representing an average annual growth rate of 6.28% year-over-year (Bexar County, n.d.-a; Bexar County, n.d.-b).
Population: From 2015 to 2025, the county’s population grew from 1,894,834 to 2,167,567, for an average annual year-over-year increase of 1.36%.
Inflation: From 2015 to 2025, inflation rose from 237 to 321.94, averaging a 3.13% year-over-year increase.
Population & Inflation: From 2015 to 2025, P&I increased by 4.49% combined.
Hence, spending by Bexar County rose more rapidly than P&I from 2015 to 2025.
Hidalgo County
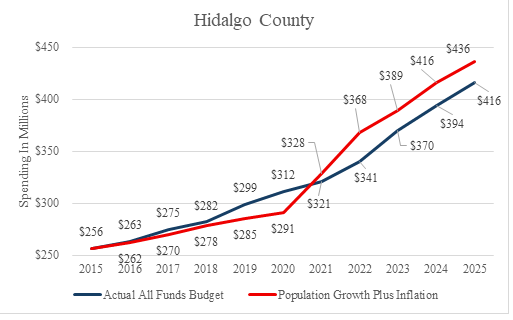
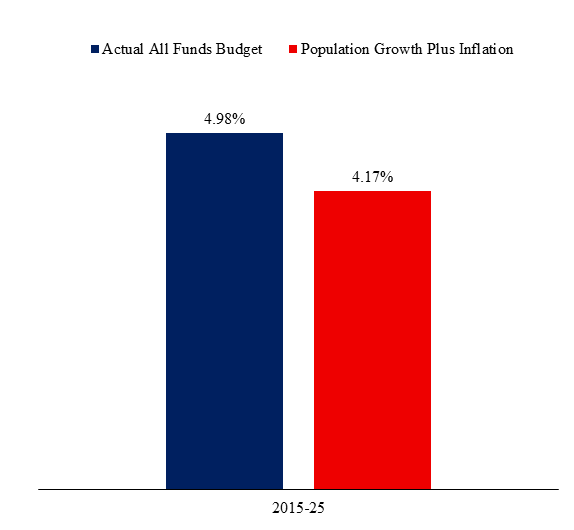
Spending: From 2015 to 2025, Hidalgo County’s adopted budget increased from $256 million to $416 million, representing an average annual growth rate of 4.98% year-over-year (Hidalgo County, n.d.).
Population: From 2015 to 2025, the county’s population grew from 837,085 to 928,384, for an average annual increase of 1.04%.
Inflation: From 2015 to 2025, inflation rose from 237 to 321.94, averaging a 3.13% year-over-year increase.
Population & Inflation: From 2015 to 2025, P&I increased by 4.17% combined.
Hence, spending by Hidalgo County rose more rapidly than P&I from 2015 to 2025.
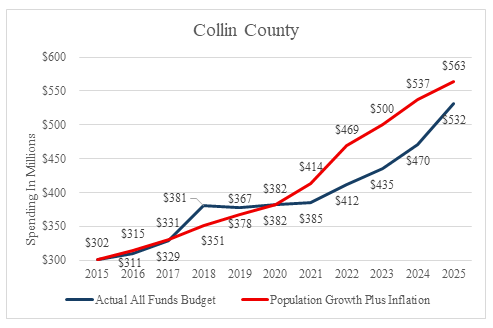
Collin County
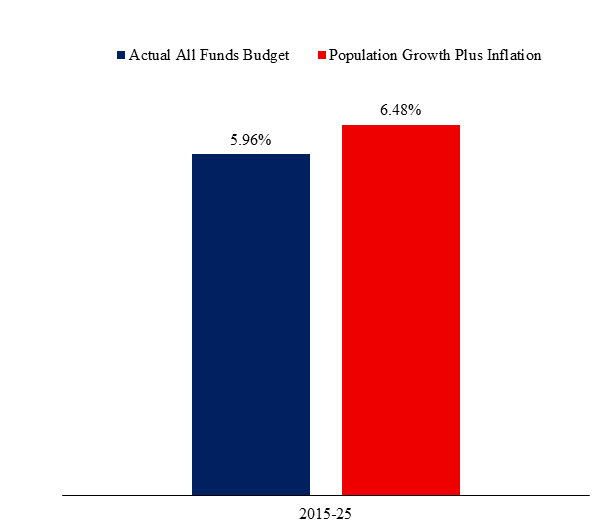
Spending: From 2015 to 2025, Collin County’s adopted budget increased from $302 million to $532 million, representing an average annual growth rate of 5.96% year-over-year (Collin County, n.d.).
Population: From 2015 to 2025, the county’s population grew from 915,507 to 1,272,999, for an average annual year-over-year increase of 3.45%.
Inflation: From 2015 to 2025, inflation rose from 237 to 321.94, averaging a 3.13% year-over-year increase.
Population & Inflation: From 2015 to 2025, P&I increased by 6.48% combined.
Hence, Collin County spending rose more slowly than P&I from 2015 to 2025.
El Paso County
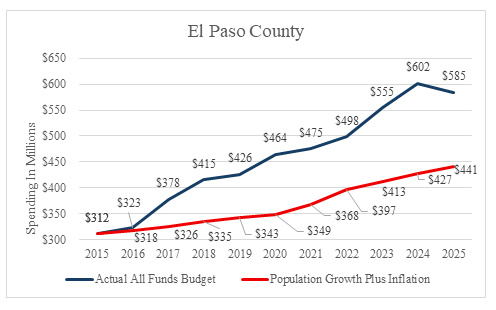
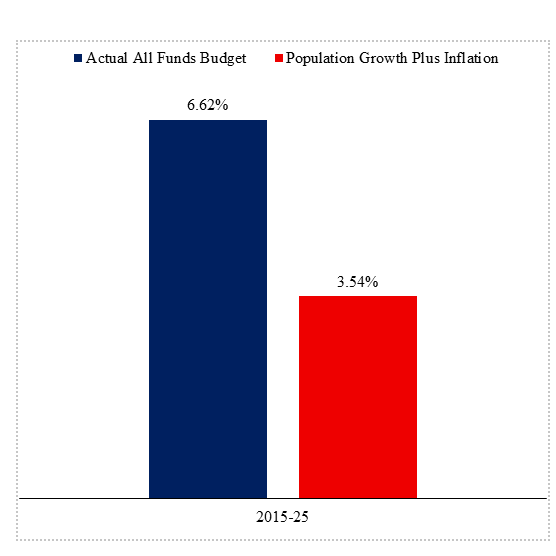
Spending: From 2015 to 2025, El Paso County’s adopted budget increased from $312 million to $585 million, representing an average annual growth rate of 6.62% year-over-year (El Paso County, 2014; El Paso County, n.d.).
Population: From 2015 to 2025, the county’s population grew from 844,314 to 879,329, for an average annual year-over-year increase of 0.41%.
Inflation: From 2015 to 2025, inflation rose from 237 to 321.94, averaging a 3.13% year-over-year increase.
Population & Inflation: From 2015 to 2025, P&I increased by 3.54% combined.
Hence, spending by El Paso County rose more rapidly than P&I from 2015 to 2025.
Fort Bend County
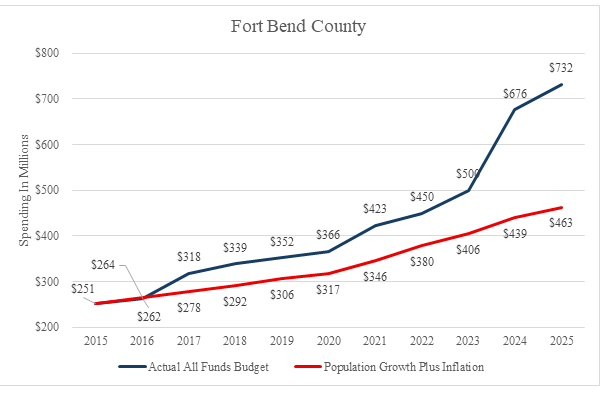
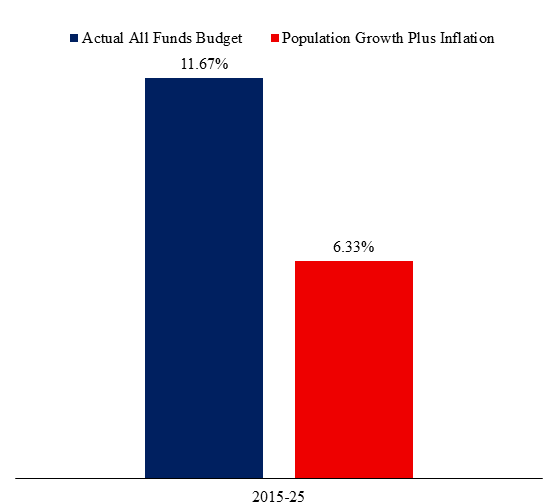
Spending: From 2015 to 2025, Fort Bend County’s adopted budget increased from $251 million to $732 million, representing an average annual growth rate of 11.67% year-over-year6 (Fort Bend County, n.d.).
Population: From 2015 to 2025, the county’s population grew from 709,550 to 971,689, for an average annual year-over-year increase of 3.2%.
Inflation: From 2015 to 2025, inflation rose from 237 to 321.94, averaging a 3.13% year-over-year increase.
Population & Inflation: From 2015 to 2025, P&I increased by 6.33% combined.
Hence, spending by Fort Bend County rose more rapidly than P&I from 2015 to 2025.
Recommendations
To better align the growth of government expenditures with population and inflation trends, the next Texas Legislature should consider instituting the following reforms:
- Impose a local spending limit. Limit the growth of a political subdivision’s spending to population and inflation, with a proviso that the restriction may only be exceeded by a supermajority vote of the electorate.
- Impose a comprehensive revenue restriction. Close loopholes in Texas’s existing property tax revenue limitation by expanding the limit to account for fees, grants, and all other tax revenue sources in determining the threshold. By expanding its scope, policymakers can put additional guardrails around government growth.
- Require efficiency. Require third-party efficiency audits to find wasteful spending and identify outdated ordinances/rules.
- Demand better budgeting. Require periodic zero-based budgeting so local governments must justify spending line by line.
Conclusion
The current trend of local government spending is untenable. Massive deficits must be made up either by directly raising revenue through tax rate increases or by issuing debt instruments that affect Texans’ bottom lines. In fact, spending has been so voracious that local government debt in Texas exceeds half a trillion dollars. With property taxes top of mind for Texans, reining in local spending must be a priority for the 90th Legislative Session.
References
Armas, M. (2025). Dallas council greenlights record $5.2 billion budget that includes more police recruits, slight tax rate cut. CBS News. https://www.cbsnews.com/texas/news/dallas-city-council-approves-record-5-2-billion-budget-despite-pushback/
Bexar County. (n.d.-a). Adopted budgets. Retrieved March 25, 2026, from https://www.bexar.org/Archive.aspx?AMID=78
Bexar County. (n.d.-b). Bexar county budget & finance department. Retrieved March 25, 2026, from https://www.bexar.org/906/Budget-Finance-Department
City of Arlington. (n.d.). Archived budget documents, budget analysis reports & revenue manuals. Retrieved March 25, 2026, from https://www.arlingtontx.gov/Government/Budget-Finance/Budget-Business-Plan/Archived-Budget-Documents-Budget-Analysis-Reports-Revenue-Manuals
City of Austin. (n.d.). Past budget documents. Retrieved March 25, 2026, from https://www.austintexas.gov/budget-excellence/city-budget#449979011-1733754464
City of Corpus Christi. (n.d.). Archived adopted budgets. Retrieved March 25, 2026, from https://www.corpuschristitx.gov/department-directory/management-budget/archived-adopted-budgets/
City of Dallas. (n.d.). Prior budgets. Retrieved March 25, 2026, from https://dallascityhall.com/departments/budget/financialtransparency/Pages/Prior-Budgets.aspx
City of El Paso. (n.d.). Tax & budget. Retrieved March 25, 2026, from https://www.elpasotexas.gov/omb/tax-and-budget/
City of Fort Worth. (2013). FY 2015 adopted annual budget and program objectives. https://www.fortworthtexas.gov/files/assets/public/v/1/the-fwlab/documents/budget-analysis/fy2015-budget/0_-_adopted_budget_book_final_fy2015_secured.pdf
City of Fort Worth. (2014). FY 2016 adopted annual budget and program objectives. https://www.fortworthtexas.gov/files/assets/public/v/1/the-fwlab/documents/budget-analysis/fy2016-budget/fy2016-full.pdf
City of Fort Worth. (2015). FY 2017 adopted annual budget and program objectives. https://www.fortworthtexas.gov/files/assets/public/v/1/the-fwlab/documents/budget-analysis/fy2017-budget/fy2017-budget.pdf
City of Fort Worth (2016). FY 2018 adopted annual budget and program objectives. https://www.fortworthtexas.gov/files/assets/public/v/1/the-fwlab/documents/budget-analysis/fy2018-budget/fy2018-budget.pdf
City of Fort Worth. (2017). FY 2019 adopted annual budget and program objectives. https://www.fortworthtexas.gov/files/assets/public/v/1/the-fwlab/documents/budget-analysis/fy2019-budget/fy2019-adopted-annual-budget.pdf
City of Fort Worth. (n.d.). Budget archive. Retrieved March 25, 2026, from https://www.fortworthtexas.gov/departments/the-fwlab/budget/budget-archive
City of Houston. (n.d.). Fiscal year operating budgets. Retrieved March 25, 2026, from https://www.houstontx.gov/budget/
City of Lubbock. (n.d.). Operating budgets & capital programs. Retrieved March 25, 2026, from https://www.mylubbock.us/300/Operating-Budgets-Capital-Programs
City of Plano. (n.d.). Budget information and documents. Retrieved March 25, 2026, from https://www.plano.gov/190/Budget-Information-and-Documents
City of San Antonio. (n.d.) Budget archives. Retrieved March 25, 2026, from https://www.sa.gov/Directory/Departments/OMB/Budget-Archives#section-2
Collin County. (n.d.). Budget documents. Retrieved March 25, 2026, from https://www.collincountytx.gov/Government/Budget/budget-documents
Dallas County. (n.d.) Fiscal year budget. Retrieved March 25, 2026, from https://www.dallascounty.org/departments/budget/fiscal_budget.php
El Paso County. (2014). Annual financial and compliance report for the year ended September 30, 2014. Gibson, Ruddock, Patterson, LLC. https://www.epcounty.com/ArchiveCenter/ViewFile/Item/125
El Paso County. (n.d.). Prior years budget. Retrieved March 25, 2026, from https://www.epcounty.com/Archive.aspx?AMID=41
Fort Bend County. (n.d.). Traditional finances. Retrieved March 25, 2026, from https://transparency.fortbendcountytx.gov/traditional-finances/#Documents
Harris County. (n.d.) Budget. Retrieved March 25, 2026, from https://budget.harriscountytx.gov/budgetprioryears.aspx
Hidalgo County. (n.d.) Budget division. Retrieved March 25, 2026, from https://www.hidalgocounty.us/76/Budget-Management-Division
Lubbock County. (2013). Adopted budget fiscal year 2014-2015. https://www.lubbockcounty.gov/egov/documents/1417615848_689941.pdf
Lubbock County. (2014). Adopted budget FY 2015-2016. https://www.lubbockcounty.gov/egov/documents/1449594800_148925.pdf
Lubbock County. (n.d.). County budget. Retrieved March 25, 2026, from https://www.lubbockcounty.gov/department/division.php?fDD=5-137
Sanders, A., & Collier, K. (2025). Austin’s new logo draws criticism over design and timing. Austin-American Statesman. https://www.statesman.com/news/article/austin-new-logo-draws-criticism-design-timing-21033175.php
Sanders, A., & Tong, C. (2025). Austin city council faces showdown over public safety cuts. Austin American-Statesman. https://www.statesman.com/news/local/article/austin-city-council-budget-meeting-public-safety-21169566.php
Tarrant County. (n.d.) Budget reports. Retrieved March 25, 2026, from https://www.tarrantcountytx.gov/en/openbooks/budget-reports.html
Texas Constitution. Article III Section 49a. https://statutes.capitol.texas.gov/?tab=1&code=CN&chapter=CN.3&artSec=3.49a
Texas Constitution. Article III Section 49-j. https://statutes.capitol.texas.gov/?tab=1&code=CN&chapter=CN.3&artSec=3.49-j
Texas Constitution. Article III Section 51-a. https://statutes.capitol.texas.gov/?tab=1&code=CN&chapter=CN.3&artSec=3.51-a
Texas Constitution. Article VIII Section 22. https://statutes.capitol.texas.gov/?tab=1&code=CN&chapter=CN.8&artSec=8.22
Texas Demographic Center. (n.d.). Vintage 2024 population estimates. Retrieved March 25, 2026, from https://demographics.texas.gov/Estimates/
Texas Government Code. Section 316.001. (1985 & rev 2021). https://statutes.capitol.texas.gov/?tab=1&code=GV&chapter=GV.316&artSec=316.001
Travis County. (n.d.). Archives. Retrieved March 25, 2026, from https://www.traviscountytx.gov/planning-budget/archives
U.S. Bureau of Labor Statistics. (n.d.). Consumer price index for all urban consumers (cpi-u). Retrieved March 25, 2026, from https://data.bls.gov/toppicks?survey=cu
U.S. Census Bureau. (n.d.-a). City and town intercensal population totals 2010-2020. Retrieved March 25, 2026, from https://www.census.gov/data/tables/time-series/demo/popest/intercensal-2010-2020-cities.html
U.S. Census Bureau. (n.d.-b). County population totals and components of change: 2020-2024. Retrieved March 25, 2026, from https://www.census.gov/data/tables/time-series/demo/popest/2020s-counties-total.html