A federal judge has curtailed the efforts of the Department of Housing and Urban Development to end the disastrous policy of Housing First. With this new development Texas is on its own to compel cities to make changes to homeless spending. This article from Austin Reform shines light on the City of Austin underscoring that devoting more money to poor policy does not solve the problem.
Austin Reform has recently dug into where the money is going in the homeless industrial complex, since for the 10th year in a row, homelessness in Austin has increased.
How has $1.5 billion been spent over six years with no success? According to the report, which you can read here:
- $35M | The Official City Ledger: The visible tip of the iceberg—general fund dollars allocated directly to the HSO for basic shelter operations, the Marshalling Yard ($8M/year), and street outreach contracts.
- $60M | The County Parallel: Travis County operates an entirely separate funding apparatus. Through its own $110 million ARPA allocation and healthcare contracts, it pours an estimated $60 million annually into the exact same network of non-profits, doubling the operational capital.
- $45M | Bond Capital (Prop A & AHFC): Voters approved a $350 million housing bond. The Austin Housing Finance Corporation draws down an estimated $45 million annually to buy and convert hotels (like Pecan Gardens). Because this is capital infrastructure, it never shows up on the city’s operational deficit sheets.
- $14M | The Federal HUD/CoC Pipeline: Stable, recurring federal Continuum of Care grants administered by ECHO that bypass city financial reporting entirely.
- $150M | “Finding Home ATX” (Off-Ledger): A public-private initiative that claimed to have raised $450 million before its website abruptly went dark. Operating with no unified public ledger, this mixed philanthropic capital sloshes through the non-profit network with zero centralized oversight.
For our recommendations on how to address this out-of-control spending, you can read our testimony below, and watch the committee hearing here.
Invited Testimony to the House Committee on Intergovernmental Affairs
Issue
Local government investment in homelessness often follows federal dollars. On its face, it makes sense to fund programs or buy buildings that will be serviced with grants from the Department of Housing and Urban Development (HUD) to reduce reliance on local taxpayers. However, one problem with that approach is that those programs have failed to meet their stated goal of “ending homelessness” In fact, the data suggest the problem may be worsening, despite the ample resources devoted to it. Thus, the public is left with a situation in which, as homeless populations increase, spending rises to accommodate them. However, the services provided fail to reduce the number of people experiencing homelessness or to engender lasting change.
To put a finer point on this challenge, this research uses the city of Austin as an example of local government spending patterns related to homelessness, examining and finally, what homelessness looks like in the five most populous Continuum of Care (CoCs).
Figure 1 explains the relationship between policy and homeless populations in the Austin/Travis County CoC. From 2007 to 2013, there was a balance between Each served its purpose, and as adjustments were made to those bed compositions, homelessness began to fall. Homeless populations fell even during one of the worst economic periods in recent U.S. history. From 2013 to 2015, the shrinking population gradually slowed and then stopped, and from 2015 to now, the homeless population has steadily increased, as indicated by the Point in Time (PIT) count.
Figure 1
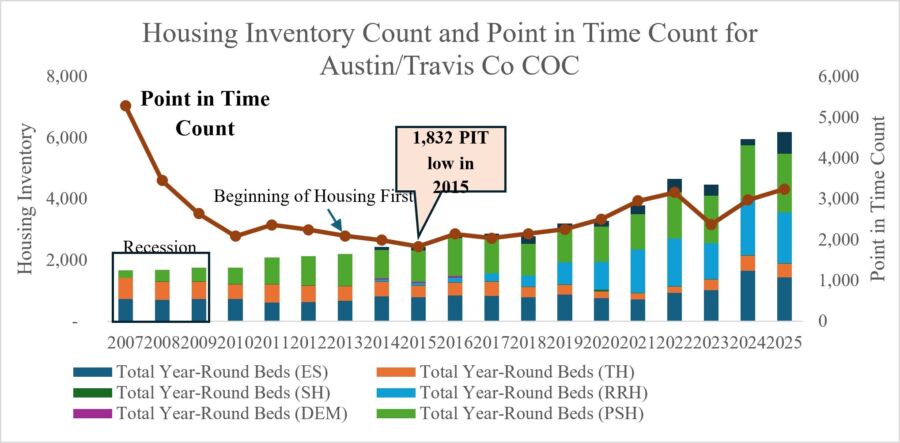
Housing Inventory Count and Point in Time Count for Austin/Travis CoC
Note. Data from 2007-2025 Point-in-Times Estimates by CoC; 2007-2025 Housing Inventory Count by CoC by the Office of Policy Development and Research.
Figure 2 shows the growing budget for homelessness from fiscal years (FY) 2017 to 2025, in millions of dollars, for the city of Austin, compared with the homeless population as estimated by PIT counts, which the CoCs report to HUD to receive grants. Even though it is widely recognized as a poor measure, it is the most uniform measure we currently have for the homeless population. The data suggests that no matter what the city does or how much money it spends, the number of homeless people continues to increase. This suggests that the current strategy is not effective at reducing homelessness and that the real, larger issue is unrelated to the amount of money spent.
Figure 2
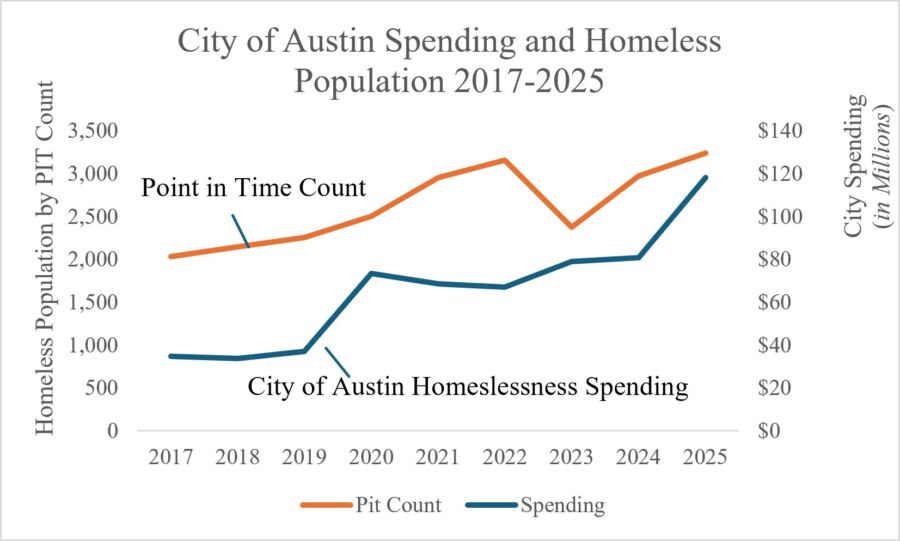
City of Austin Spending and Homelessness Population 2017-2025
Note. Data from 2007-2025 Point-in-Time Estimates by CoC by Office of Policy Development and Research; 2020-21 City of Austin Approved Budget; City of Austin Approved 2021-22 Budget; City of Austin Approved 2022-23 Budget; City of Austin Approved 2023-24 Budget; and City of Austin Approved 2024-25 Budget.
Figure 3 shows the breakdown in Austin homeless spending by program type for FY 2025. Roughly two-thirds of all funds are directed at and housing vouchers. These programs all have their place in the CoC environment but are not long-term solutions to homelessness. On the other hand, supportive services, such as workforce development, accounted for just over 5%. This dynamic—wherein certain ineffective services and programs receive the bulk of funding to the detriment of other effective approaches—indicates that homelessness spending does not need to increase; it only needs to be reapportioned to achieve better results.
Figure 3
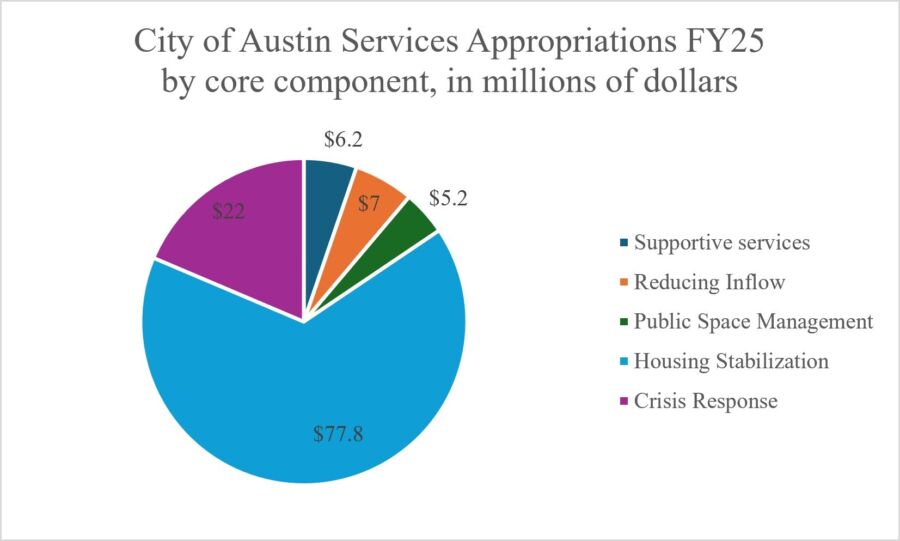
City of Austin Services Appropriations FY25 by Core Component, in Millions of Dollars
Note. Data from FY2024-2025 Budget Question Response to Request for Information by City of Austin.
Finally, Table 4 shows the top five CoCs by PIT count. This is to show that while Texas has one of the highest homeless populations in the country, the majority of cases fall within the major urban areas. If we can align policy to more effectively address key contributing factors related to homelessness, beginning with the populations being served by these CoCs, spending on homelessness programs might be better targeted and reduced to a more manageable level.
Table 4
Five Most Populous CoCs in Texas
| Five Most Populous CoCs in Texas | |
| Continuum of Care | PIT Count |
| San Antonio/Bexar County CoC | 3,625 |
| Austin/Travis County CoC | 3,240 |
| Dallas City & County/ CoC | 3,541 |
| Fort Worth/Arlington/Tarrant County CoC | 2,594 |
| Houston, Pasadena, Conroe/Harris, Ft. Bend, Montgomery, Counties CoC | 3,325 |
Note. Data from 2007-2025 Point-in-Time Estimates by CoC by Office of Policy Development and Research.
Recommendations:
1) Texas CoC programs should be audited either through a third-party or the Texas Regulatory Efficiency Office. With the new Notice of Funding Opportunity (NOFO) from HUD, it is necessary to understand the scope of our resources and capabilities to best align services with the new direction from HUD, while also exposing and eliminating fraud, waste, and abuse. SB 399 proposed a method to conduct these audits, including metrics and recommendations on how to consolidate, eliminate, or promote homelessness service entities based on the results of the audit (SB 399, 2025).
2) There must be a means for police, EMS, and street outreach teams to share HMIS data. Currently, important data on homeless individuals is being withheld by CoCs due to privacy concerns. However, access to data like the number of law enforcement encounters or mental health interventions can provide context for interactions during outreach, medical, or law enforcement interactions. The Waikiki Business Improvement District was able to implement this type of data sharing and collection. Over the course of three years beginning in 2022 unsheltered homelessness decreased by 78% and crime decreased by 18% (Jacobs, 2026). HB 636 from the 89th legislative session (HB 636, 2025).
3) Explore options for crisis service centers. Even if a city has the political will to clear homeless encampments, Having more space will keep people off the streets without clogging jails or hospitals. SB 2487 from the 89th legislative session explains how a service center would work with a mental health advisory board and case-by-case management for individuals brought into the center (SB 2487, 2025). However, while SB 2487 presents a good model for crisis service centers, there remains an issue of who would administer them.
The issue that needs to be addressed to make this work is whether these centers should be fully private (except for what is necessary to have the authority to hold based on mental state and left to independently seek federal grants); a mix of private and public, where state, county and city would partner with NGOs and businesses in its operation; or purely public, which would place all operations squarely in the hands of the city, state, or county.
4) Hold cities accountable to Governing authorities and service providers must come to agreement on achievable goals in addressing homelessness that also include enforceable action. For example, reaching a number of “encampments cleared” that represents the realities of what goes into camp clearing. If a city does not make what could be considered progress by a reasonable person towards that goal, then enforcement mechanisms like withholding its share of sales tax and/or injunctions to compel compliance. SB 241 from the 89th legislative session serves as model legislation that creates metrics and enforceable action if cities neglect their duties regarding homelessness (SB 241, 2025).
Conclusion
Allowing CoCs to operate without accountability has increased costs for Texans while failing the homeless population these programs were designed to serve. Although homelessness cannot be solved by policy alone, the state can use its authority to assess the scope of the problem, realign resources, and create a policy environment that moves Texas closer to ending homelessness.