The Texas Comptroller of Public Accounts has published a new report offering interesting insights and details on local property tax trends, with a particular emphasis on “tax rate and value information for tax years 2022 and 2023.” This information has the potential to illuminate certain aspects of the hotly anticipated property tax relief and reform debate.
With that in mind, here are a few major takeaways from the report.
1. Property Taxes are BIG.
Despite all previous efforts to reverse course, property taxes remain “the largest tax assessed in Texas.” In fact, for fiscal year (FY) 2022, property tax revenues reached $80.8 billion, which represented 47.5% of the total. In FY 2023, the property tax generated $81.4 billion or 46.1% of all state-local tax revenue.
The next largest tax by dollar amount was the state sales tax. In FY 2022, it produced nearly $43 billion or 25.2% of the total. In FY 2023, it generated slightly more income for the government’s coffers, coming in at $46.6 billion or 26.3% of total tax revenue.

2. Local Governments Bear Much of the Blame.
The responsibility for Texas’ tax burden falls more on local governments than it does state government. According to the Texas Comptroller, “…local taxing units consistently collect about 54 percent of all taxes in the state, while state government collects about 46 percent.” This figure, of course, includes both property, sales, and other taxes.
One reason why local tax revenues may be elevated is that local governments generally lack any sort of expenditure limit. As I noted in a recent Texas Public Policy Foundation report:
“At the state level, several constitutional and statutory rules govern the rate of spending growth and consumption. For example, the Texas Constitution includes a debt limit, a welfare spending limit, a pay-as-you-go limit, and a limitation on the growth of certain appropriations. In addition, state law also provides for a consolidated general revenue (CGR) cap that ‘limits the biennial growth of CGR appropriations to the estimated compounded growth of state population and monetary inflation.’ In tandem, these fiscal rules work together to restrain the appetite of state government and create reasonableness within the appropriations process.
Yet while multiple constitutional and statutory constrain the state’s finances, ‘no such [similar] restrictions apply to municipal or county spending.’ Instead, local expenditures increase as much as political conditions allow.”
Without any meaningful expenditure restraint, local tax revenues likely bear some additional upward pressure to provide for the governments’ spending appetite.
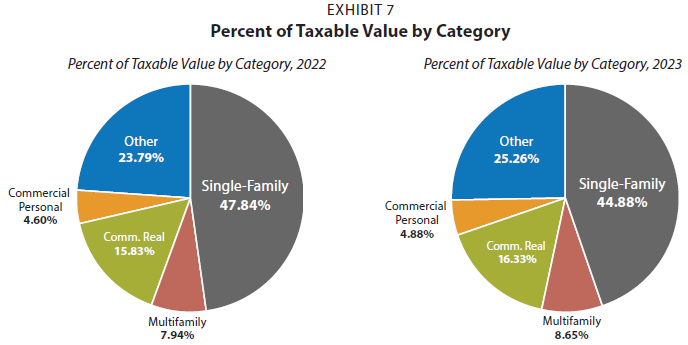
3. Single-Family Residential Comprised Almost Half of All Taxable Value.
The term taxable value refers to a property’s assessed value minus any applicable exemptions. From a tax perspective, this amount is important to know since “[t]he tax rate is applied to this value to determine your tax bill.” On a collective basis, it is also the value that, in combination with an adopted tax rate, is used to calculate a governmental entity’s tax levy, or its claim on people’s money.
In FY 2022, the total taxable value in school districts statewide was estimated at $3.9 trillion. The following year, in FY 2023, this figure rose to slightly more than $4 trillion. In both cases, the type of property most responsible for constituting this value was single-family residential, meaning that homeowners generally carried the load as far as taxable values.
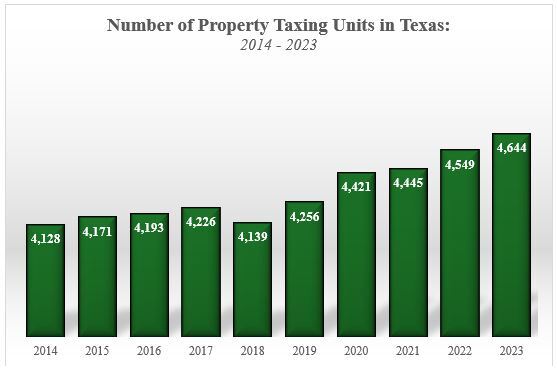
4. The Number of Local Governments is on the Rise.
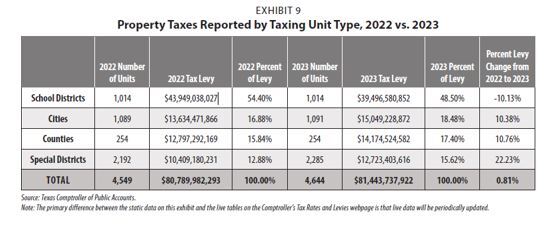
Over the years, the State has created oodles of local governmental entities capable of levying a property tax. In fact, in FY 2023, the total number of property taxing units rose to 4,644 entities. This rather large number was comprised of 1,014 school districts; 1,091 cities; 254 counties; and 2,285 special purposes districts.
This number is not only large presently, but it has also grown substantially over the recent past. Consider that from 2014 to 2023, the number of property taxing units rose from 4,128 to 4,644. That represents a 12.5% increase for the period and may help to partially explain the rise in tax bills, especially as these taxing units very often overlap.
5. School District Property Taxes are the Main Problem for Taxpayers.
Among all property taxing units, the burden imposed by school districts remains paramount.
In FY 2023, property tax collections exceeded $81.4 billion. Of that amount, slightly less than half (48.5%) was due to school district taxation. There was some modest reduction in school taxes from the prior year thanks to the 2023 Legislature’s historic tax relief package; however, the burden is still substantial and the overall property tax levy rose slightly.
The other taxing unit types, i.e. cities, counties, and special districts, all generated relatively similar amounts, ranging from $12.7 billion to $15 billion.
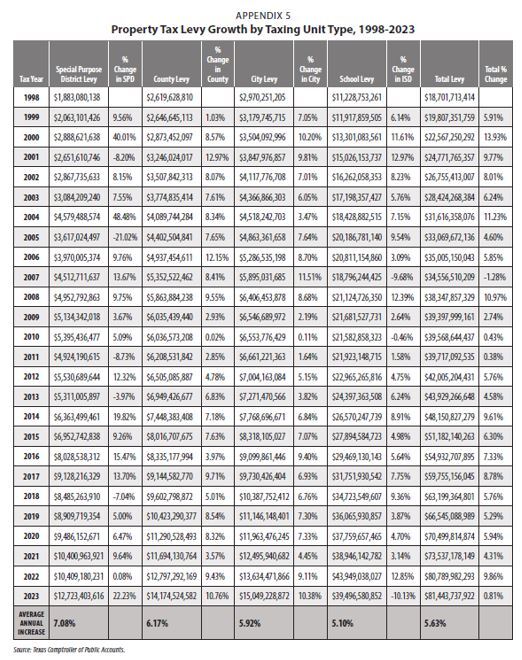
6. Long-Term Property Tax Levy Growth Remains High.
Over a long-term time horizon, property tax levies have been on a relentless march toward ever more. No matter the economic conditions, legislative reform, nor public sentiment.
Consider that from 1998 to 2023, the average annual increase in all property tax levies rose by 5.6%. In other words, the amount of money that local governmental entities sought to siphon out of the private market increased by almost 6% every year for the last 20 years, no matter the circumstance or crisis. That’s an indication that governments have been allowed to grow too much for too long.