This commentary originally appeared in Forbes on June 30, 2015.
Discussion about America’s K-12 education system is fraught with politics and misinformation. Teachers unions seek to boost salaries and benefits. Highly-paid administrators and the large and growing cadre of non-teaching support staff have their own agenda. Politicians and pundits look to score points on the thinnest of reeds.
The high stakes—$545 billion of tax money, and growing, spent every year on pre-K to 12th grade education—encourage textbook examples of hyperbole and demagoguery.
In February, 2011, New York Times columnist Paul Krugman wrote, “How… can (Texas) prosper in the long run with a future work force blighted by… lack of education.”
While in August 2011, U.S. Secretary of Education Arne Duncan said of Texas, “I feel very, very badly for the children there.” The highest-ranking federal education official went on to say, “Texas may have the lowest high school graduation rate in the country,” noting that the education system in Texas “has really struggled” under then-Governor Rick Perry.
President Obama’s former spokesman, Robert Gibbs, said a few days later, “…Texas has one of the worst education systems.”
The great thing about statements on education is that there is an abundance of fact checking data out there.
After checking the facts, Krugman, Duncan, and Gibbs earn an “F.”
In the height on irony, Secretary Duncan’s own cabinet department issued a report in 2013 on education in America’s five largest states showing that Texas did best while California fared the worst. In “Mega-States: An Analysis of Student Performance in the Five Most Heavily Populated States in the Nation,” the U.S. Department of Education compared educational performance in California, Florida, Illinois, New York and Texas. The report’s findings: California’s math, reading, and science standardized test scores fell below the national average for both fourth and eighth graders while Texas scored the strongest, with fourth graders meeting the national average in the three basic topics while eighth graders scored above average in math and science and below average in reading.
But, this federal report covered the National Assessment of Educational Progress (NAEP) standardized tests given in 2009 and 2011, might Texas’ superior performance have been an aberration? The latest Department of Education data suggests otherwise.
Nationwide 2013 test scores for math and reading continue to show Texas leading its diverse, big state peers.
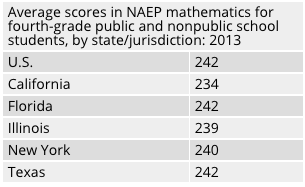
Fourth-grade mathematics test results for 2013 show Texas and Florida students at the national average with New York and Illinois below the national average and California significantly below average.
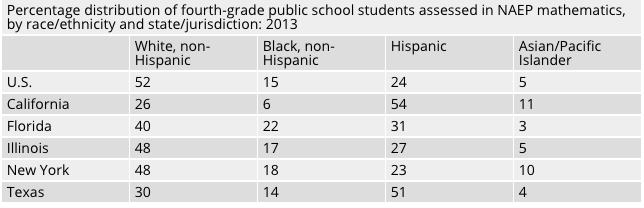
So, Texas and Florida led the pack in fourth-grade math scores. However, America’s largest states, diverse as they are, not all are equally diverse. Only two of the largest states are majority-minority among their overall population: California and Texas. But diversity is even greater among fourth graders, with white, non-Hispanic test takers only totaling 26 percent in California and 30 percent in Texas.
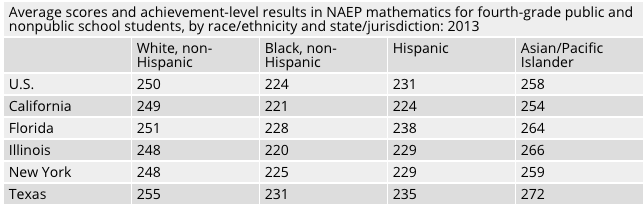
Since English language learners and children in poverty tend to have greater challenges in education, it would be instructive to see how the five big states test scores stack up to each other by race and ethnicity. This table shows that Texas fourth graders in three of four of the nation’s largest racial or ethnic groups outperformed their big state peers, with Hispanic students in Florida edging out Texans. Texas and Florida students were the only ones to perform above the national average across the board.
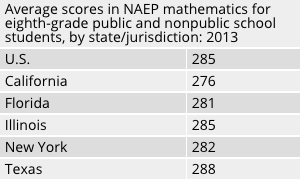
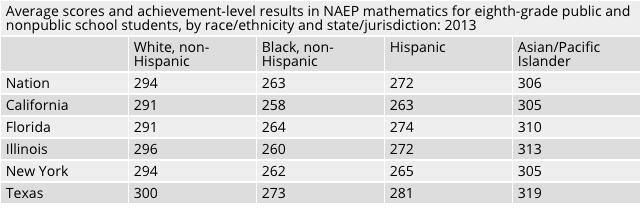
What about eighth-grade mathematics? Overall, Texas is tops among the five big states and is the sole big state to beat the national average. California is last.
In addition, Texas has the best scores among all four demographic groups, higher than the other four large states and better than the national average. California has the weakest scores.
Sense a trend here? Don’t hold your breath for criticism of California, it’s a blue state through and through so, by definition, their intentions cannot be questioned meaning that their results must not be mentioned.
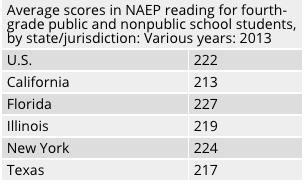
Moving on to reading, the effect of large numbers of English learners can be seen, with California having the lowest average scores.
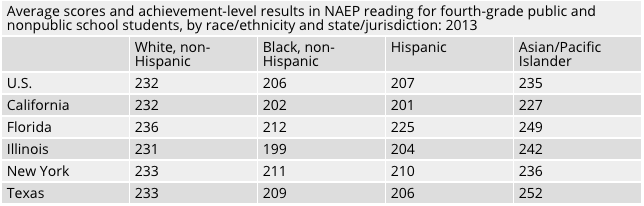
Breaking the results down by the four largest demographic groups allows a comparison among like groups with New York and Florida scoring above the national average in fourth-grade reading in all four categories and Texas scoring above average in three of the four categories.
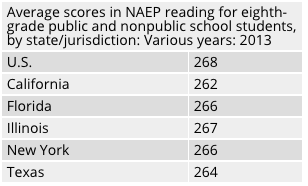
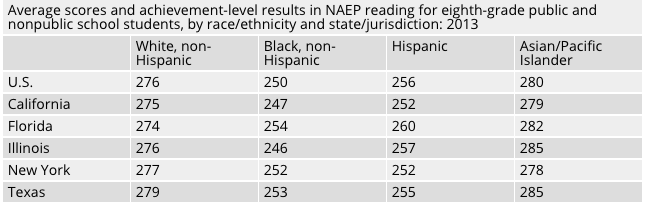
As was the case for fourth-grade reading, California brings up the rear for eighth grade reading as well.
Looking at the results by demographic group shows is instructive. Florida and Texas score above the national average in three of the four groups. California is last again.
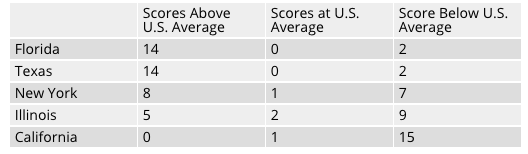
The table below recaps the 2013 mathematics and reading test results among the four largest racial and ethnic groups in the U.S. for the fourth and eighth-grades in the five most-populous states, showing Florida and Texas at the top, scoring above the national average in 14 of 16 categories and California at the bottom, scoring above average in none of the 16 comparisons.
Now, to be fair, Texas did have the lowest percentage of adults with a high school degree back in 2009 according to the U.S. Census Bureau (California was third-lowest then and within the margin of error of Mississippi). But, this oft-quoted and frequently misused statistic is driven by immigration—young adults moving to Texas and California from mainly south of the border. And, as the U.S. Census Bureau is wont to do, they updated this statistic, showing that in the most recent year, California, not Texas, has the lowest percentage of adults with a high school degree.
Rather than cite data that largely measures the pull of immigration to a state, it would be more instructive to gauge the state’s K-12 educational system. The national standardized test scores from the U.S. Department of Education show Texas and Florida doing well, but how many students in the large states actually graduate from high school?
The National Center for Education Statistics within the Department of Education released a report detailing high school graduation rates in the 2011 to 2012 school year. Their data shows that Texas tied with Nebraska and Wisconsin for the second-highest graduation rate in the nation, 88 percent. Iowa was the nation’s leader at 89 percent. The national average was 80 percent.
Emphasizing what a remarkable achievement Texas’ graduation rate really is, among the top states, Texas’ general population is almost 50 percent more diverse than the national average, with more than triple the share of minorities than live in Nebraska and quadruple that of Wisconsin or Iowa.
Among the big states, California’s four year graduation rate was 78 percent, Florida, 75 percent, Illinois, 82 percent, and in New York, 77 percent of high school students graduate.
The bottom line for K-12 education results is clear: among the five biggest states where more than one in three Americans call home, Texas has the best K-12 education system. Further, Texas does far better than its big state peers in preparing students of all races and ethnicities for success.
Texas must do even better, of course, and it can by following Nevada’s lead in bringing true choice to public education by passing a universal education savings account program.
Chuck DeVore is Vice President of Policy at the Texas Public Policy Foundation. He served as a California State Assemblyman. He is a lieutenant colonel in the U.S. Army (retired) Reserve.