This post draws from TPPF’s comprehensive explanation of Texas school finance, available here.
Defining Revenue and Expenditures
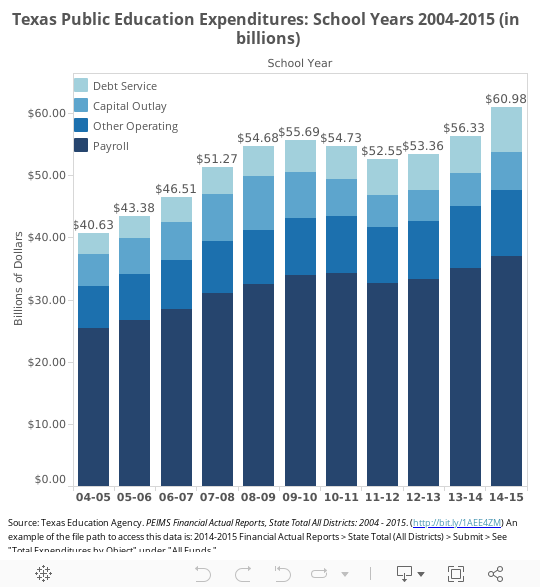
It’s common to hear support for changing the level of education funding, but any conversation on this topic should start with a definition of how much we’re currently spending. For the sake of context, we can begin by noting that education is consistently the largest part of our state’s budget (see p. 11). According to the TEA, total expenditures for public education in the 2014-15 school year were about $60 billion:
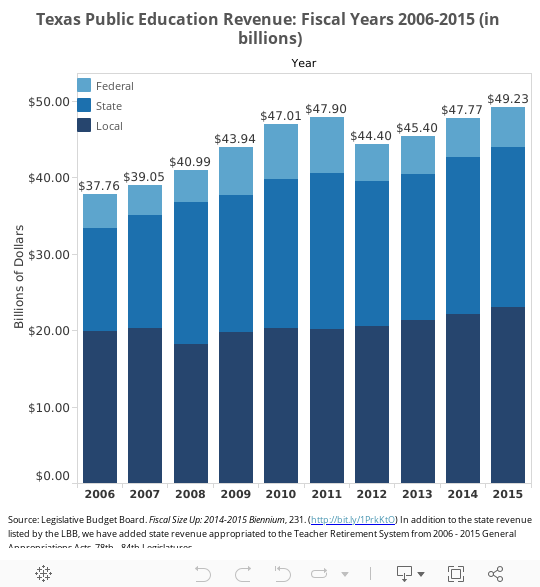
Unfortunately, these numbers don’t quite square with the Legislative Budget Board’s most recent Fiscal Size-Up, which reports that federal, state, and local revenue for PK-12 revenue is $50 billion in the most recent fiscal year:
To figure out the difference we talked to a couple school finance experts. Looking at the numbers, one smiled and said, ‘if you want one answer, ask one person.’
Tradeoffs
So which is it? $49 billion or $60 billion? It depends on what you’re looking for. The LBB’s data summarizes revenue; the TEA’s data summarizes expenditures. It might sound obvious, but these aren’t the same thing.
There’s a couple basic reasons these might not be the same. Imagine your household budget: if you save more than you spend, revenue will be higher; if you spend more than you save, expenditures will be higher. Their relationship is a first sign of financial health. But there are exceptions. Even if you live within your means it’s possible that you saved up over the years to buy a car, house, or college education. In a year that you pay for one of these, expenditures will be larger than revenue.
The reason underlying the relationship between public education revenue and expenditures will differ by school district. To get a better understanding, it’s helpful to study individual districts’ finances. At the state level, the most accurate description of total spending comes from the TEA’s report on expenditures.
Spending per Student
Defining total spending is the first step in figuring out how much Texas is spending per student. (which is no easy task) According to the TEA, total spending in the 2014-15 school year was $60,977,192,546. In that school year, there were 4,778,559 students in attendance. Therefore, total average spending per student was $12,761.
Two sharp questions should be made here: why are you dividing by students in attendance rather than total enrollment? Second, the $12,761 is just an average; since students are allotted different amounts, isn’t this misleading?
To answer the first: Texas funds PK-12 education based on student attendance, but we didn’t always do this. When the state constitution established public education in 1876, it funded schools based on the census count of school-age children in a community. (see p 22) In the late 1940s, Texas began to fund education based on attendance, and has done this ever since. So while there were 5,210,148 students signed-up to attend Texas schools in the 2014-15 school year, the system funds students only if they are in school. The funding formulas aren’t driven by total enrollment, which is why we divide by attendance.
To answer the second: the statewide average is a starting point. The topic of establishing a student-centered system which provides every student an equitable allotment deserves a longer explanation than I can provide here. Without a doubt, district adjustments drive more funds to some school districts than others, and student weights drive more funds to some student programs than others. Each adjustment and weight is explained in Section 3 of the study, and our recommendations on this topic are offered in Section 4. (see p 50-51)
The data behind the graphics can be downloaded here. This post draws from TPPF’s comprehensive explanation of Texas school finance, available here.