The issue of persistent poverty in many of America’s urban centers is once again in the news. U.S. Secretary of Housing and Urban Development Dr. Ben Carson commented this week that when, as pediatric neurosurgeon, he had a young patient from East Baltimore, he faced a “horrible dilemma,” when having to discharge patients back to homes, “infested with rats and roaches and ticks and mold and lead and violence.”
Baltimore’s poverty rate was 22.4%, averaged over the five years ended in 2017. The national rate was 12.3%. However, the Official Poverty Measure that doesn’t account for the high cost of living in some regions, such as the Pacific Coast and the Northeast—the poverty threshold (according to this measure) is the same in all cities and regions across the 48-contiguous states.
The Census Bureau’s newer, more comprehensive estimate of poverty, the Supplemental Poverty Measure, does account for regional housing cost differences as well as for noncash benefits directed at the poor, such as food and rental assistance.
Using the U.S. Census Bureau’s Current Population Survey data made available through the Minnesota Population Center at the University of Minnesota, detailed information on Supplemental Poverty rates in major metropolitan centers can be developed.
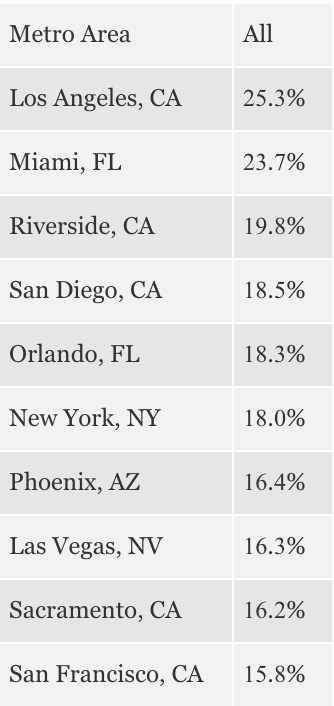
The table below highlights the 10 metropolitan areas with the highest Supplemental Poverty rates among the nation’s 30 largest metro areas, as averaged with surveys collected over five years from 2014 to 2018. It shows high poverty clustered on the high-cost coasts.
The Baltimore, Maryland metro area has an estimated Supplemental Poverty rate of 15.6%, placing it 11th highest out of the 30 largest metro areas.
One key driver of high housing costs is the lack of respect for property rights. In cities with restrictive zoning, heavy regulations, and other factors that limit the construction of housing stock, the market can’t easily meet demand, creating artificial scarcity that drives up costs.
In addition to the cost of living, the share of the population with full time jobs, demographics, family status and education levels, have a large affect on poverty.
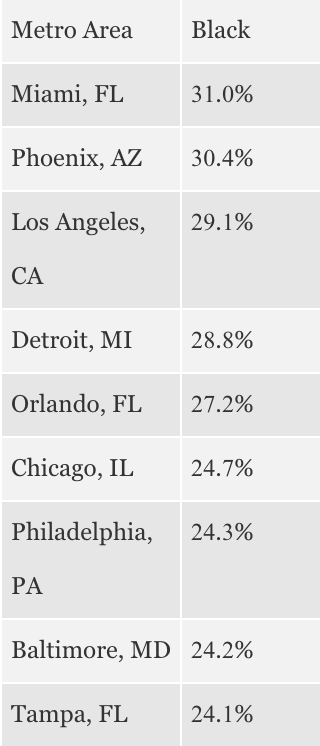
Looking again at the 30 largest metros but focusing on two important racial or national origin groups—African Americans and Mexican Americans—shows a different view of poverty, though still one dominated by the coasts. The table below shows the ten-highest metros for Supplemental Poverty among African Americans from 2014 to 2018.
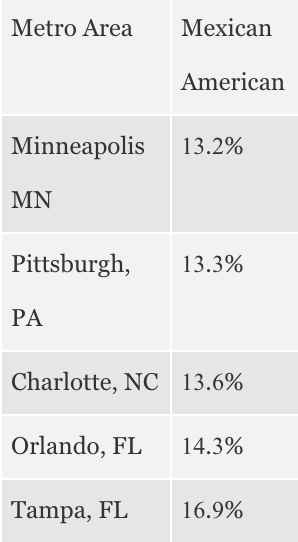
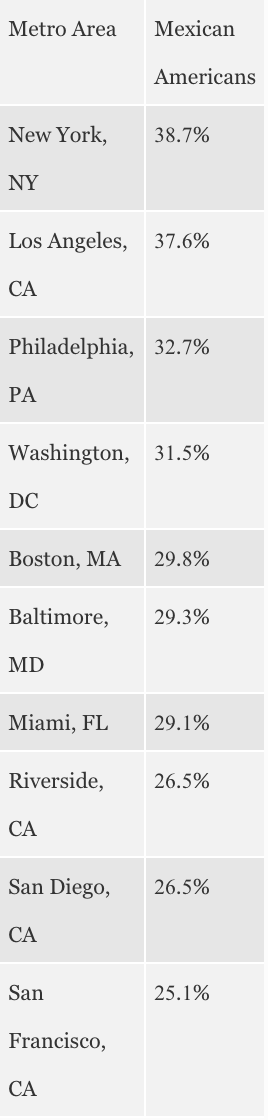
Looking at the poverty rates for Hispanics of Mexican national origin as distinct from Hispanics is important, as Hispanics are far from a monolithic group. Hispanics tracing their heritage to Mexico not only constitute the largest share of Hispanics, they are also the most widely distributed among the Hispanic ethnic group. The table below shows the 10 metro areas with the highest Supplemental Poverty among Mexican Americas as averaged from 2014 to 2018.
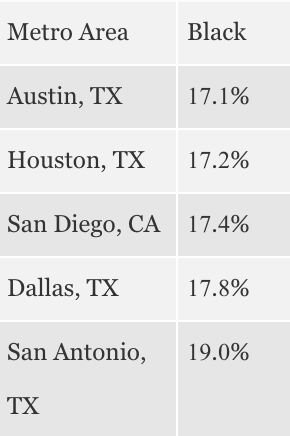
Of the five metropolitan areas with the lowest black Supplemental Poverty rates, four are in Texas and one is in California. There are large military populations in both San Diego and San Antonio. One significant predictor of staying out of poverty is graduating from high school. For several years, Texas has had the nation’s highest black high school graduation rate, which may partially explain Texas’ metro areas low rates of African American poverty.
Among Hispanics of Mexican national origin, the table below shows the lowest five Supplemental Poverty rates among the 30 largest metros. San Antonio, Texas ranks 6th with a 17% poverty rate while Dallas and Houston are also in the top ten for the lowest poverty rates.