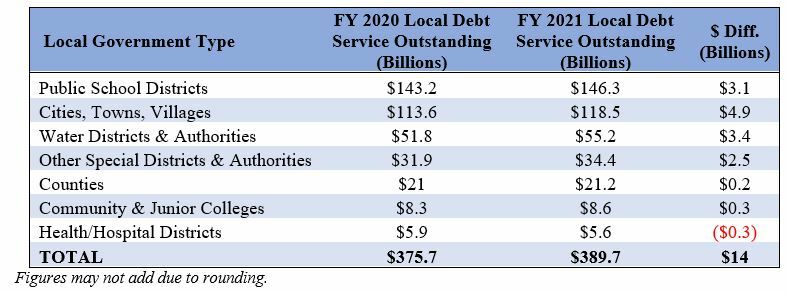
Last week, we revealed that local government debt had grown to $389.7 billion in fiscal year 2021, an incredible increase of $14 billion over the previous year’s total. This week, we dig a little deeper into the data to see which types of local government are most responsible for the borrowing binge.
A few things are obvious. First, school districts were the most heavily indebted local government type in raw terms. Collectively, ISD debt totaled $146.3 billion in FY 2021 or about $27,000 for every enrolled student. This level of indebtedness was substantially greater than every other local government type. Second, cities increased their borrowing the most from one year to the next. From FY 2020 to FY 2021, city government debt grew by almost $5 billion. That was well above the next highest total, water districts ($3.4 billion). Third, counties, community colleges, and hospital districts actually did quite well to limit their public debt consumption. The three types of entities increased their borrowing by only $0.2 billion combined.
Still, the data shows there’s more work to be done to stop local governments from pigging out on public debt, especially among school districts and cities. If there’s a silver lining it’s that we have no shortage of ideas on how to do just that.