California, with 39.5 million people, and Texas, with 28.3 million, are two of America’s four majority-minority states, the other two being Hawaii and New Mexico. As such, the education systems’ effectiveness in the two most diverse states that 1-in-5 Americans calls home is of vital interest to the rest of the nation.
Because of the high stakes involved in public education—student achievement as well as billions of dollars ($72.6 billion in taxpayer dollars were spent in California in 2016 and $45.9 billion in Texas) the rhetoric surrounding the issue tends to obscure facts on the ground—by design.
An example of how data can be used to mislead happened in the run up to the 2012 presidential election, when NBC’s Brian Williams interviewed then-Texas Governor Rick Perry, saying,
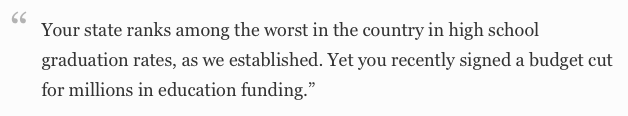
The “fact” of Texas’ nation-worst high school graduation rate was even posted on Wikipedia for a few years. But that was misleading; critics of Texas and Gov. Perry weren’t truly discussing graduation rates. Instead, they were looking at the percentage of adults with a high school diploma. Those are very different metrics.
In 2011, Texas did have the nation’s lowest rate of adults with a high school degree, but California was third-lowest and within the margin of error of Mississippi’s second-lowest rate. In both California and Texas, the reason for the low rates of adults with high school degrees was simple—the large number of immigrants from Mexico and other nations who never graduated from high school and, in many cases, didn’t speak English.
A few years later it was California with the lowest percentage of adults with a high school degree—but somehow that data nugget, of keen interest in Texas’ case, became irrelevant when it passed to California.
In fact, at the time of Perry’s interview by Williams in November 2011, Texas was tied for the 4th-highest high school graduation rate in the nation at 86%—the clear opposite of Williams’ “worst in the country” claims. California was 33rd with a 76% high school graduation rate. The national average in the 2010-11 school year was 79%.
The latest national data on high school graduation rates for the 2014-15 school year show Texas as 4th in the nation at 89% with California coming in at 31st with an 82% graduation rate. The national average was 83.2%. For low income students, Texas was first in the nation, with an 85.6% graduation rate compared to California’s 15th place with a 78% graduate rate for low income students. The national average was 76.1%.
Of course, graduating from high school means little if the graduation was conferred through social promotion—the practice of allowing students to advance through school even while failing a grade.
The National Education Assessment Progress (NAEP) publishes reports on how well America’s schools are teaching our children. In 2017, Texas 4th-grade students were assessed with a score of 241 on math vs. 232 in California. The national average was 239. In 4th-grade reading, both states scored 215 with the national average at 221. In 8th grade math, Texas students scored 282, the same as the national average, with California at 277, “significantly lower than national public schools.” Reading scores for 8thgraders were 260 in Texas and 263 in California. So, out of math and reading assessments for grades 4 and 8, Texas students scored better than those in California on 2 and tied in 1 with California students testing better in 1 category.
Unlike the NAEP tests, SATs are not national standardized tests in the sense that participation rates vary widely from state-to-state. In Delaware, Idaho, and Washington, D.C., 100% of students take the SAT because the test is mandated. In North Dakota, only 2% of students take the SAT while the competing ACT is far more popular. As a result, average test scores are highly dependent on participation rates because, as a higher share of students take the test, the test average approaches the mean. In 2018, California SAT takers scored an average of 1,076 on the assessment of college readiness while in Texas, the score was 1,032. But Texas’ participation rate was 66% vs. 60% in California, as a larger share of Texas students expected to go to college. A higher proportion of Texas students take the ACT than in California as well.
In addition to individual effort and intelligence, student achievement is also linked to socio-economic factors—most critically, a stable home life, as well as an effective teacher. According to Governing magazine’s summary of U.S. Census Bureau data for 2016, the U.S. spent $11,762 per student on public school spending. California spent $11,495 while Texas spent $9,016. But the cost of living in California and Texas are vastly different. Adjusting the state figures for the cost of living in 2016, California’s cost of living was 114.4% of the national average compared to Texas’ at 96.9%. This results in real per capita expenditures on public schools of $10,048 in California and $9,304 in Texas. The instruction spending per pupil gap was even smaller as California spent more of its education dollars on administrative overhead: $5,987 in California after the cost of living adjustment vs. $5,690 in Texas.
Also, the National Education Association teachers’ union estimated that the average number of students in average daily attendance per teacher in 2016 was 22.5 students per teacher in California and 14.2 students per teacher in Texas. The national average was 15.1 students per teacher. Only Nevada and Utah had fewer teachers as a share of students than did California while Texas had more teachers than the national average.
As for graduate degrees, California state ranks 14th in the nation with 31.4% of adults having a college degree compared to 27.6% in Texas, coming in at 29th. Adults with a college degree are more a reflection of the type of economy a state has and the resultant employment demand than it is necessarily a reflection of the state’s education system. So yes, California does rank higher than Texas for college degrees. But a better gauge of well-being is the Supplemental Poverty Measure, which shows that California has the nation’s highest poverty rate, at 19% compared to 14.7% in Texas.
Finally, there’s the issue of education policy direction. While California was an early adopter of charter schools in response to widespread parental concern over the mediocre public school system, for the past decade, charter schools have been under sustained assault by the California Teachers Association (CTA), the state’s most-powerful labor union. The CTA has successfully pushed the legislature to gradually impose more restrictions on California’s charter schools with the aim of leveling the distinctions they enjoy with traditional public schools.
Texas, in contrast, has moved in the direction of education reform and innovation. While full school choice for students remains an aspiration (due largely to ongoing unease from rural and suburban lawmakers), Texas students are enjoying a growing array of charter schools from which to choose. It has become far easier for charters, a variation of public school that’s privately managed, to open anywhere in the state.
In the Central Texas region around Austin, for example, charter enrollment has ballooned to 30,000 students from about 3,000 in 2006. As a result, enrollment in the Austin school district, now at 81,650, has declined every year for five years. About 12% of students attend charters in Travis County, home to Austin, compared to 5% statewide. In California, 10% of public school students attend charter schools.
The growing availability of alternatives to traditional public schools should begin to manifest itself in higher student achievement. Research by the Hoover Institution’s Caroline M. Hoxby, Ph.D. when she was at MIT, suggests that traditional school performance begins to improve when alternative school enrollment surpasses 6%.
This public school choice enrollment threshold was passed in Central Texas sometime in 2014, setting off a sustained innovation drive by traditional public schools to compete for market share.
In Round Rock, a suburban community north of Austin, for example, the school board recruited Steve Flores, a superintendent from Texas’ Rio Grande Valley with a successful track record in improving performance to meet the competitive challenge from charter schools. In short order, Superintendent Flores established specialty schools, such as an early college high school and three arts integration academies at the grade school level.
Other districts in the greater Austin area have followed suit, providing students with more options such as language, science and fine arts academies that will likely result in higher-quality educational outcomes.
The Lone Star State should continue to consider innovative ideas to improve education in its upcoming legislative session. California, in the meantime, may find it a challenge to build on reforms started in 1992, when it was the second state in the nation after Minnesota to pass a charter school law.