Does history suggest that property taxes are too high in the city of El Paso? And, if so, have local decision-makers actively helped or hurt the situation?
To help answer these questions, let’s review the city’s 2024 Annual Comprehensive Financial Report (ACFR) and gather four types of data—i.e., tax levies, local population, total tax rates, and taxable values—over a 10-year time horizon. Using these audited estimates, we can gauge the growth of government (i.e., tax levy trends), assess its reasonability (i.e., has government grown in response to surging population?), and evaluate whether local elected officials are using their prescribed authority in the tax rate-setting process to properly balance rates and values.
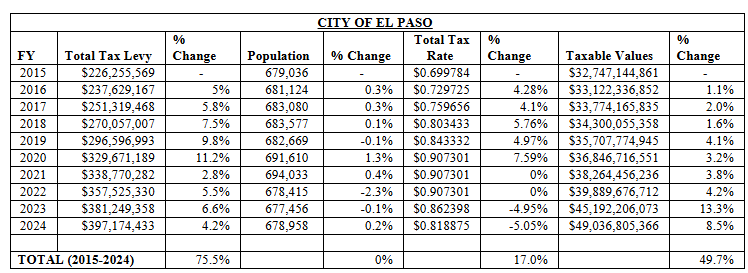
To begin, we can observe that the city’s total tax levy—which may be understood as: “The sum of the maintenance and operation and debt service levies generated by applying a [governmental entity’s] adopted tax rates to its locally assessed valuation of property for the current tax year”—experienced robust growth over the last decade. In fact, from 2015 to 2024, the city’s total tax levy rose from $226.3 million to $397.2 million, equating to a 75.5% increase.
Now, on its own, this percentage change does not provide enough context to discern whether it was a reasonable or unreasonable rate of growth. For that, we must compare the decade-long growth in tax levies (+75.5%) with another value of similar significance, like population. By comparing these two metrics, it is possible to gain greater insight into the situation’s fairness.
So here’s what the data shows: In 2015, the number of city residents totaled 679,036. By 2025, that figure edged down slightly to 678,958, effectively resulting in a 0% population change for the time period.
Thus, on the one hand, the city’s main revenue source grew by 75.5% over the last 10 years. On the other hand, it experienced no population growth whatsoever.
This dynamic raises a few interesting questions, but chief among them is this—what, if anything, have El Paso’s elected officials done to contain or contribute to this disparity?
To explore this question, let’s consider how the city’s total tax rate and taxable values have changed. For clarification purposes, total tax rates refers to the sum of: “a rate for debt service payments—often called the ‘I&S rate’ or interest and sinking fund rate—and a rate for day-to-day maintenance and operations—the ‘M&O rate.’” The term taxable values can be understood as: “[t]he property value you pay taxes on.” In this case, taxable values is construed to apply on a community-wide basis, rather than on an individual level.
From 2015 to 2024, the city’s total tax rate rose by 17%. Simultaneously, total taxable values grew by nearly 50%. The effect of these two measures increasing at the same time was higher taxes.
While it is true that city officials do not have control over property values (mostly), it is also true that “[l]ocal governments set tax rates.” This means that city officials have the discretion to adopt higher or lower tax rates to compensate for property value growth or decline. The decision these local elected officials make every year has a direct and obvious impact on your property tax bill.
In an ideal situation, an “inverse relationship” exists between rates and values, where as one goes up, the other comes down or vice versa. That relationship is not sufficiently present in this case, which helps to explain why El Paso’s property tax is so burdensome.
Moving forward, city leaders need to consider a different approach to the property tax. Namely, officials ought to limit levy growth to population growth, adopt the no-new-revenue tax rate or below, and consider other good government reforms to ease cost pressures.
Changes like these are sorely needed, as evidenced by the data.